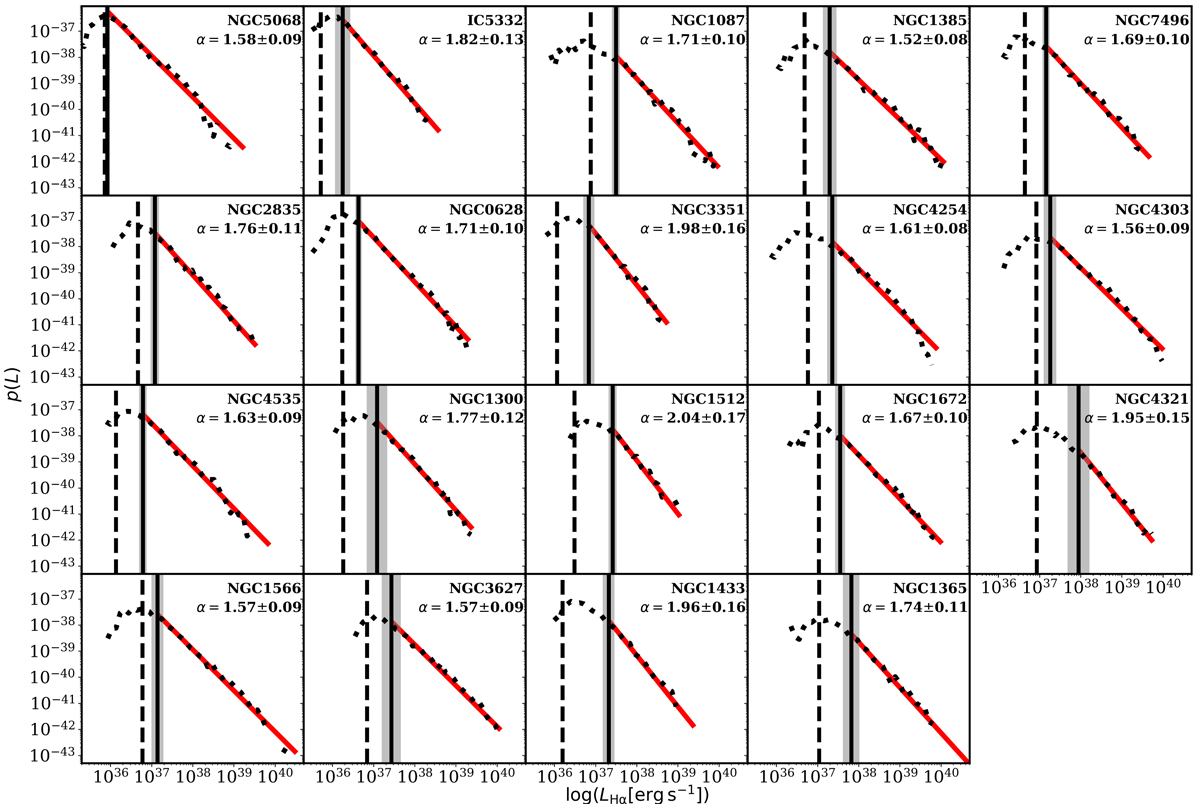
Fig. 2.
Download original image
Best fitting models of the H II region LF for the galaxies of our sample. Galaxies are ordered by increasing stellar mass from top left to bottom right, and their names are indicated within each panel. The dotted black line indicates the empirical PDF, plotted as p(L) versus the logarithm of the H II regions’ Hα luminosity expressed in erg s−1. The vertical dashed line indicates the estimated completeness limit. The vertical solid black line and the shaded gray area indicate the best fitting Lmin and its uncertainty. The LF best fitting model is marked by the solid red line, while the associated slope, α, and its uncertainty are indicated in the upper-right corner of each panel.
Current usage metrics show cumulative count of Article Views (full-text article views including HTML views, PDF and ePub downloads, according to the available data) and Abstracts Views on Vision4Press platform.
Data correspond to usage on the plateform after 2015. The current usage metrics is available 48-96 hours after online publication and is updated daily on week days.
Initial download of the metrics may take a while.