Open Access
Fig. 11.
Download original image
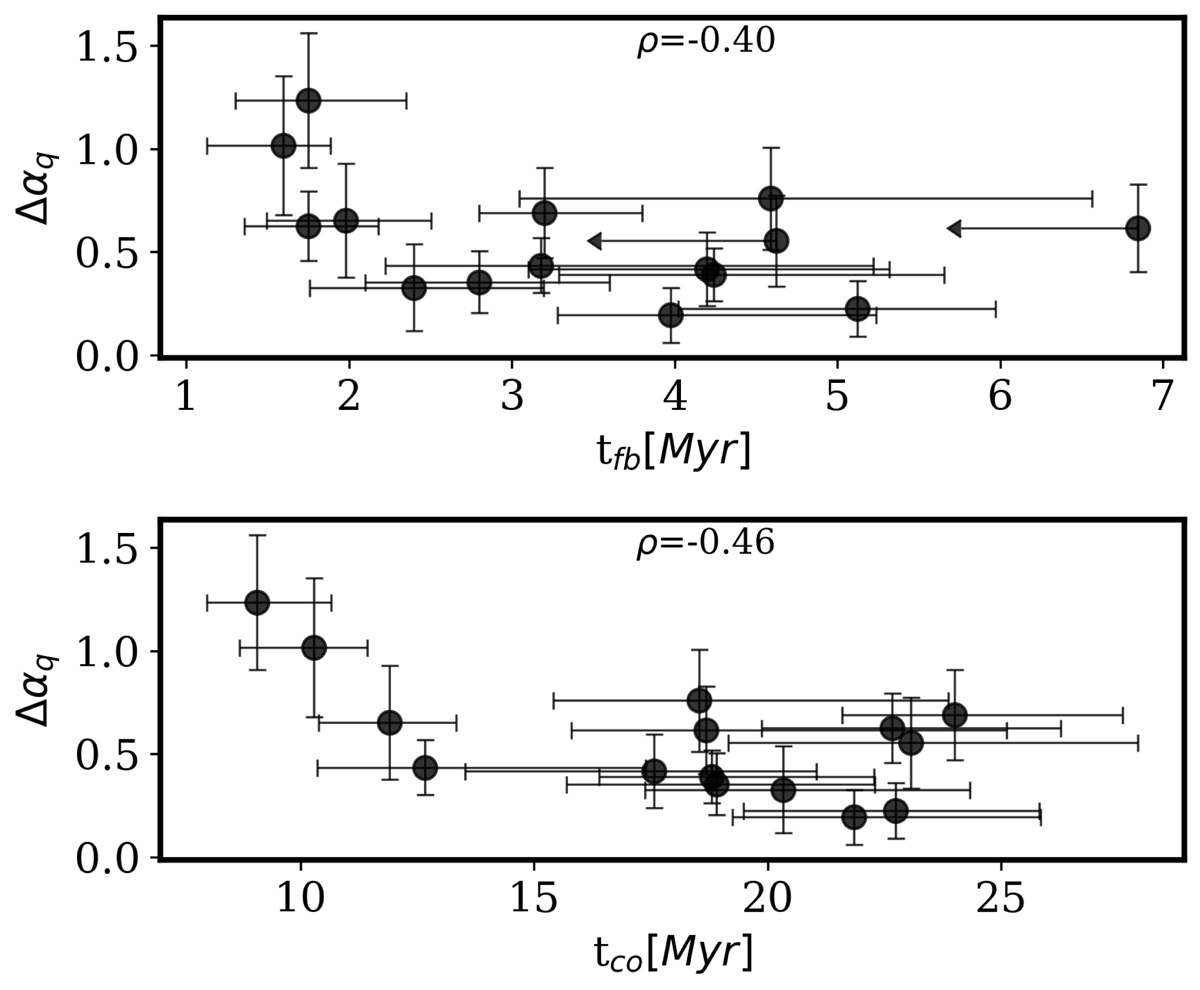
Change in LF slope between H II regions with low and high ionization parameters (derived as αq< − αq> as reported in Table 4) as a function of the feedback timescales (upper panel) and the GMC lifetime (lower panel). For each panel we report the Spearman correlation coefficient, ρ, between the plotted quantities.
Current usage metrics show cumulative count of Article Views (full-text article views including HTML views, PDF and ePub downloads, according to the available data) and Abstracts Views on Vision4Press platform.
Data correspond to usage on the plateform after 2015. The current usage metrics is available 48-96 hours after online publication and is updated daily on week days.
Initial download of the metrics may take a while.