Fig. 1.
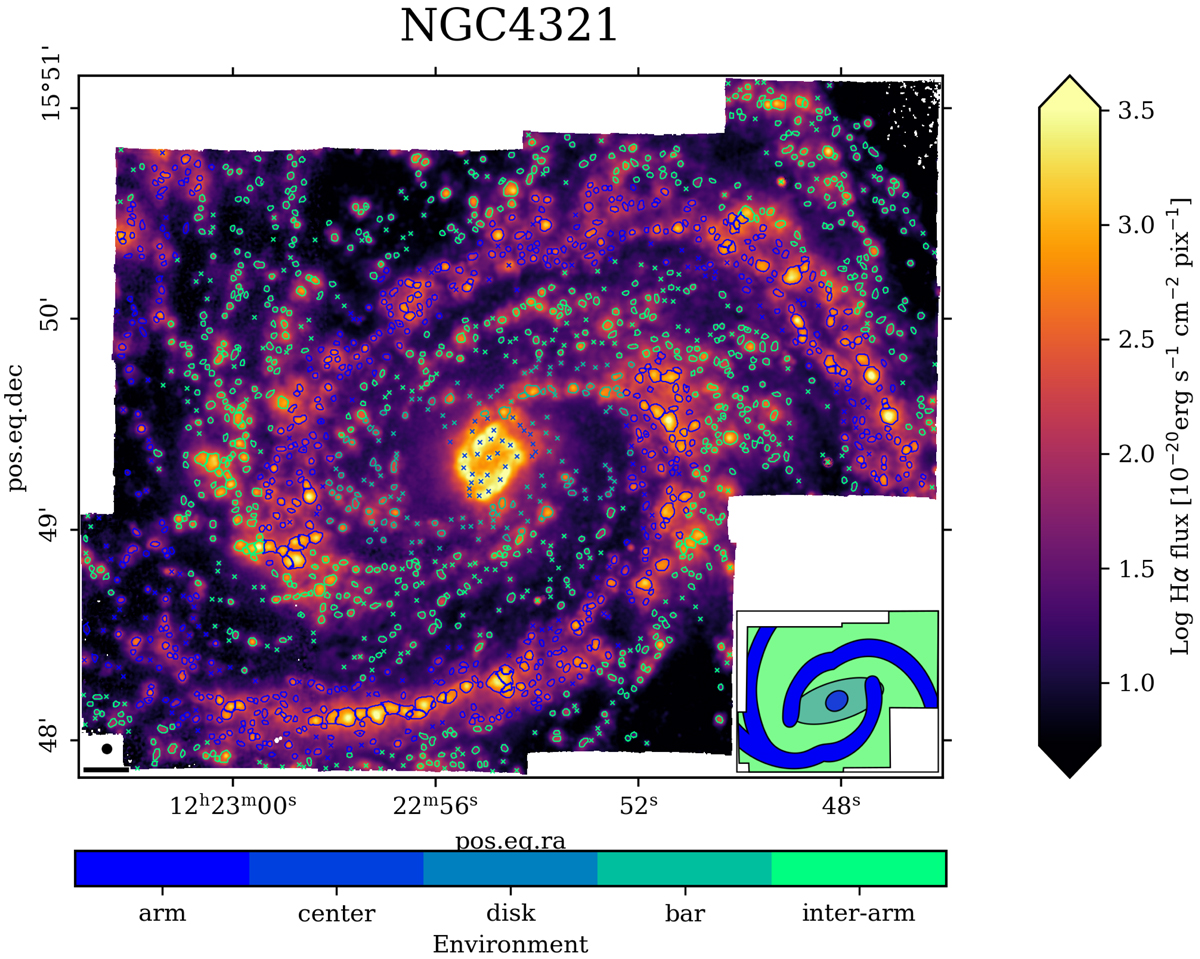
Download original image
H II regions and environments for NGC 4321. The figure shows the Hα emission in the background, color coded according to the color scheme on the right, overlaid with the borders of the H II regions in our catalog. The centers of the nebulae that have been discarded by our selection criteria are marked with crosses. Lower-left corner: the black circle indicates the PSF of the MUSE observations, and the black line marks a physical scale corresponding to 1 kpc. Both the H II regions and the discarded nebulae are color coded according to our definition of environments as outlined by the color scheme at the bottom and shown in the bottom-right sketch.
Current usage metrics show cumulative count of Article Views (full-text article views including HTML views, PDF and ePub downloads, according to the available data) and Abstracts Views on Vision4Press platform.
Data correspond to usage on the plateform after 2015. The current usage metrics is available 48-96 hours after online publication and is updated daily on week days.
Initial download of the metrics may take a while.