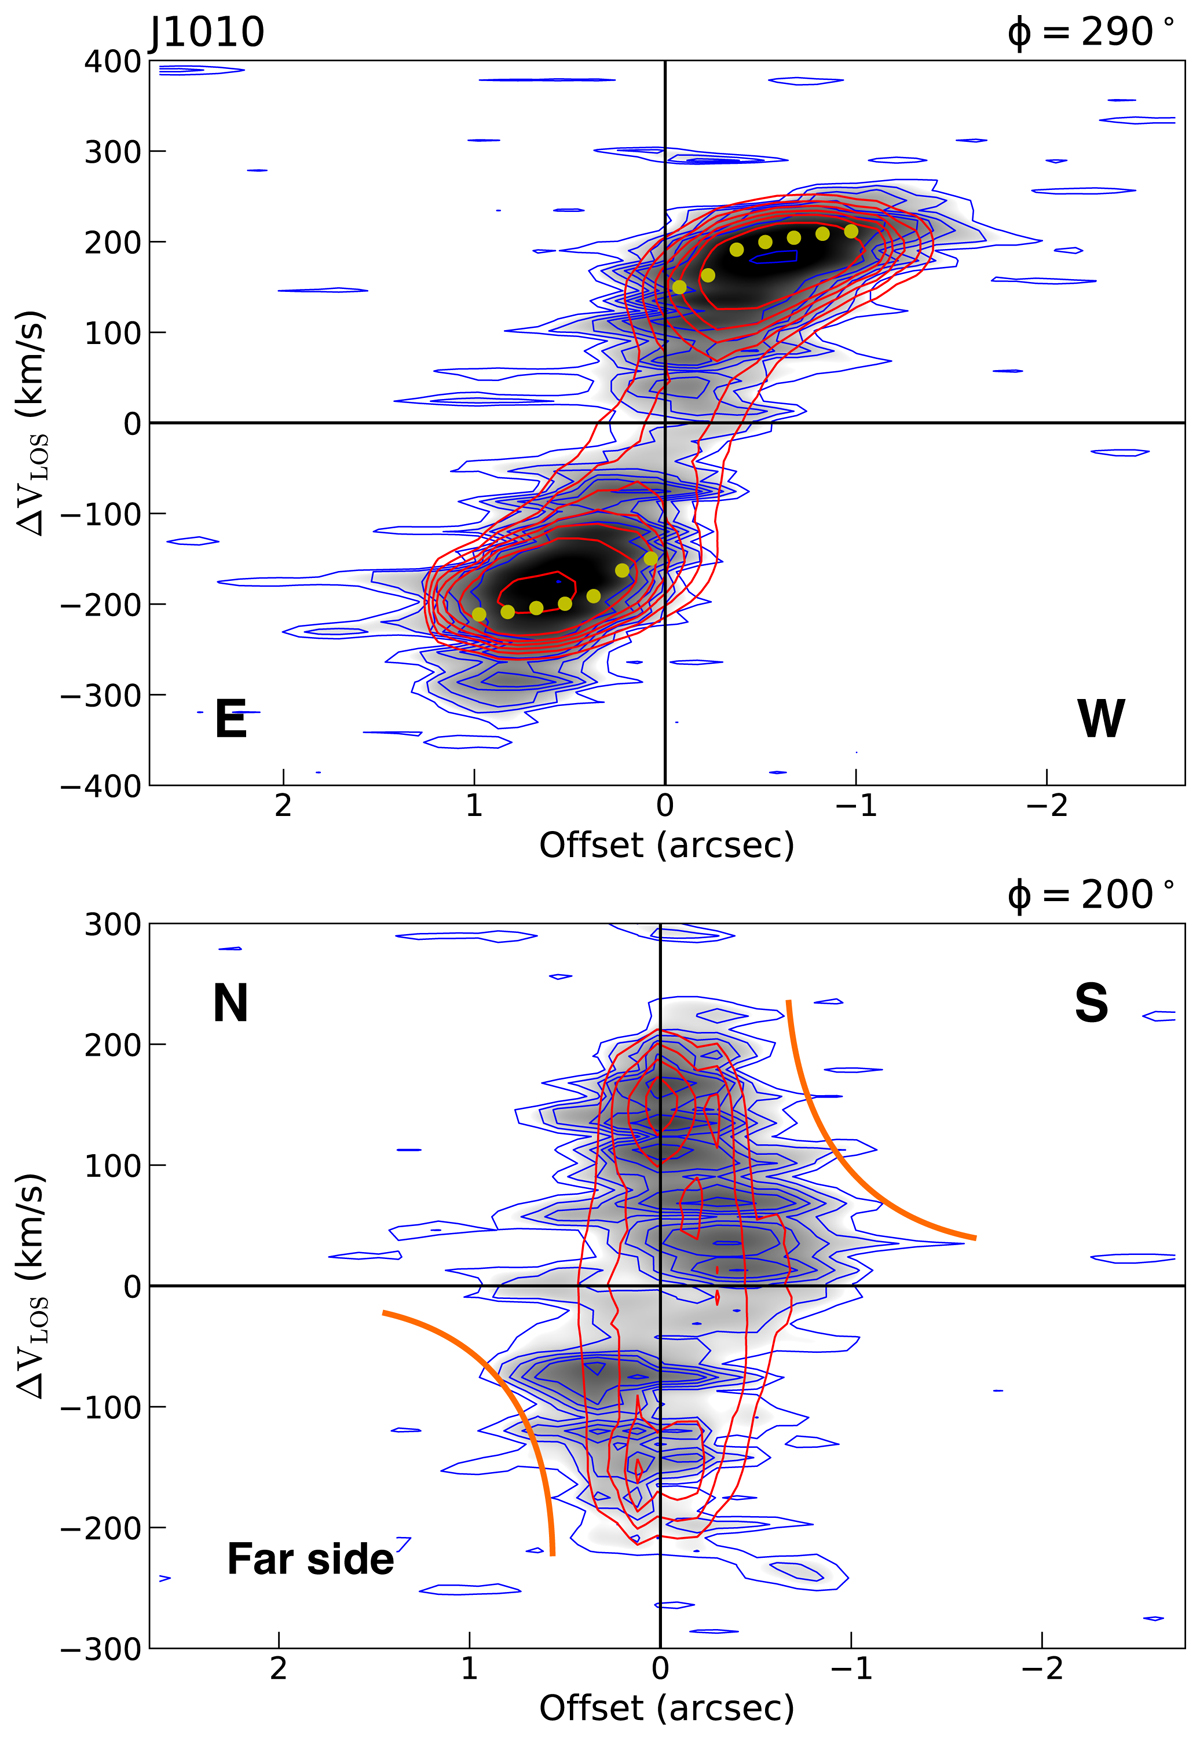
Fig. 6.
Download original image
PV diagrams along the CO kinematic major axis (PA = 290° = −70°) and minor axis (PA = 200° = 20°) of J1010 extracted with 3DBAROLO. We used a slit width of ∼0.8″. Blue contours correspond to the observed CO(2−1) emission above 2σ and red contours to the 3DBAROLO rotating disk model (inclination of i = 36°) shown in Fig. 5. Yellow dots are the average model velocities at different radii. Blue contours outside the boundaries of the model correspond to noncircular motions. Orange lines indicate the positive/negative pattern that, in the case of this QSO2, might be produced by either a coplanar inflow or a spatially extended vertical outflow.
Current usage metrics show cumulative count of Article Views (full-text article views including HTML views, PDF and ePub downloads, according to the available data) and Abstracts Views on Vision4Press platform.
Data correspond to usage on the plateform after 2015. The current usage metrics is available 48-96 hours after online publication and is updated daily on week days.
Initial download of the metrics may take a while.