Free Access
Fig. E.1.
Download original image
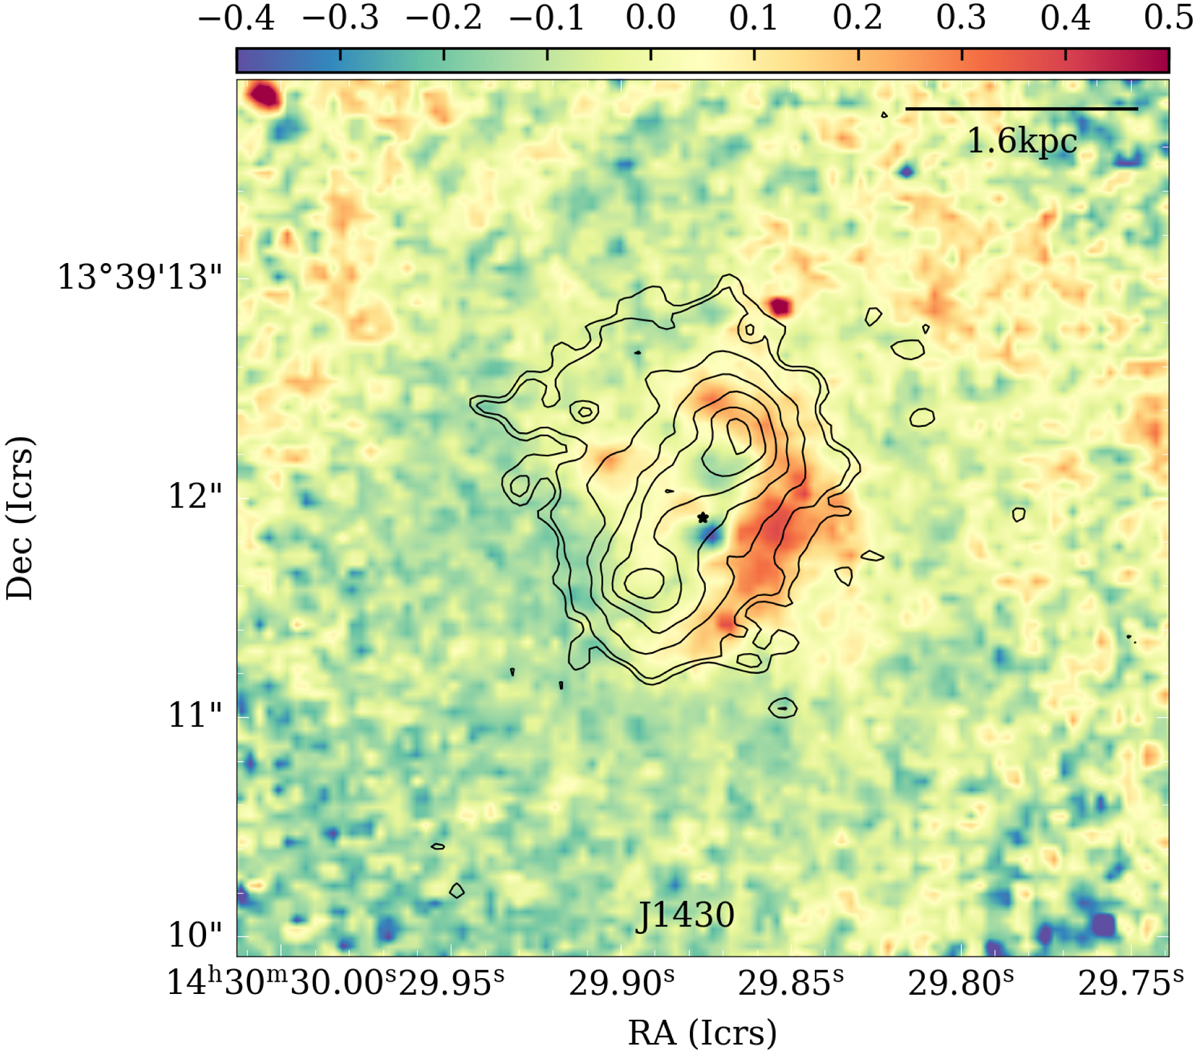
Same as in Figure C.2 but with the CO(2−1) contours of J1430 (0.15, 0.2, 0.35, 0.5, 0.65, 0.8, and 0.95 times the peak of CO emission), overlaid on the r-i color map derived from HST/WFC3 F621M and F763M images. The color map corresponds to the central 4″ × 4″.
Current usage metrics show cumulative count of Article Views (full-text article views including HTML views, PDF and ePub downloads, according to the available data) and Abstracts Views on Vision4Press platform.
Data correspond to usage on the plateform after 2015. The current usage metrics is available 48-96 hours after online publication and is updated daily on week days.
Initial download of the metrics may take a while.