Fig. D.1.
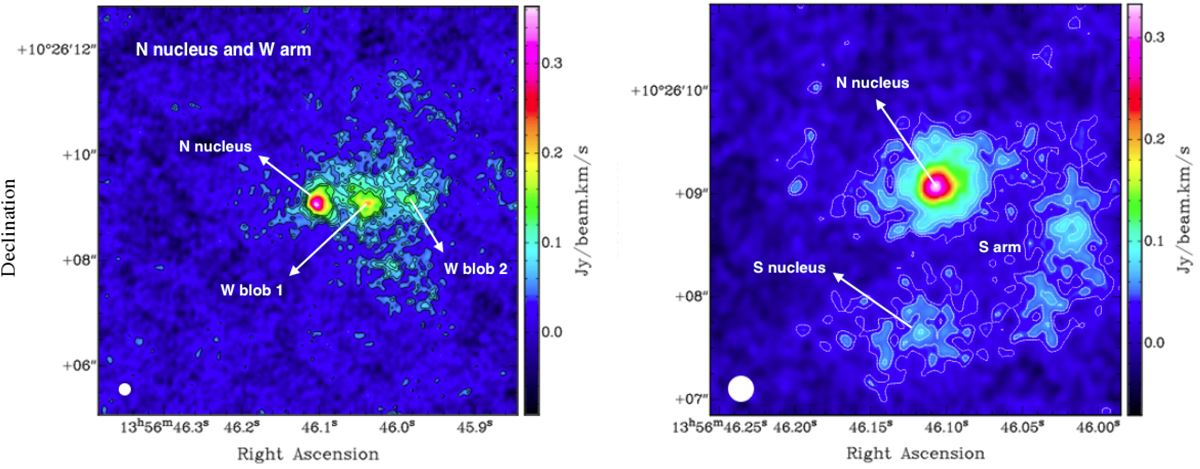
Download original image
CO(2−1) moment 0 maps of J1356 integrating over the emission detected in the “W arm,” westward of the N nucleus (left panel; black contours go from 2 to 7σ with σ = 0.0196 mJy beam−1), and in the S nucleus, ∼1.1″ south of the N nucleus (right panel; white contours go from 2 to 5σ with σ = 0.0156 mJy beam−1). The N and S nuclei are connected by a CO-emitting bridge or spiral arm. The beamsize is indicated in the bottom left corner of each panel.
Current usage metrics show cumulative count of Article Views (full-text article views including HTML views, PDF and ePub downloads, according to the available data) and Abstracts Views on Vision4Press platform.
Data correspond to usage on the plateform after 2015. The current usage metrics is available 48-96 hours after online publication and is updated daily on week days.
Initial download of the metrics may take a while.