Fig. C.2.
Download original image
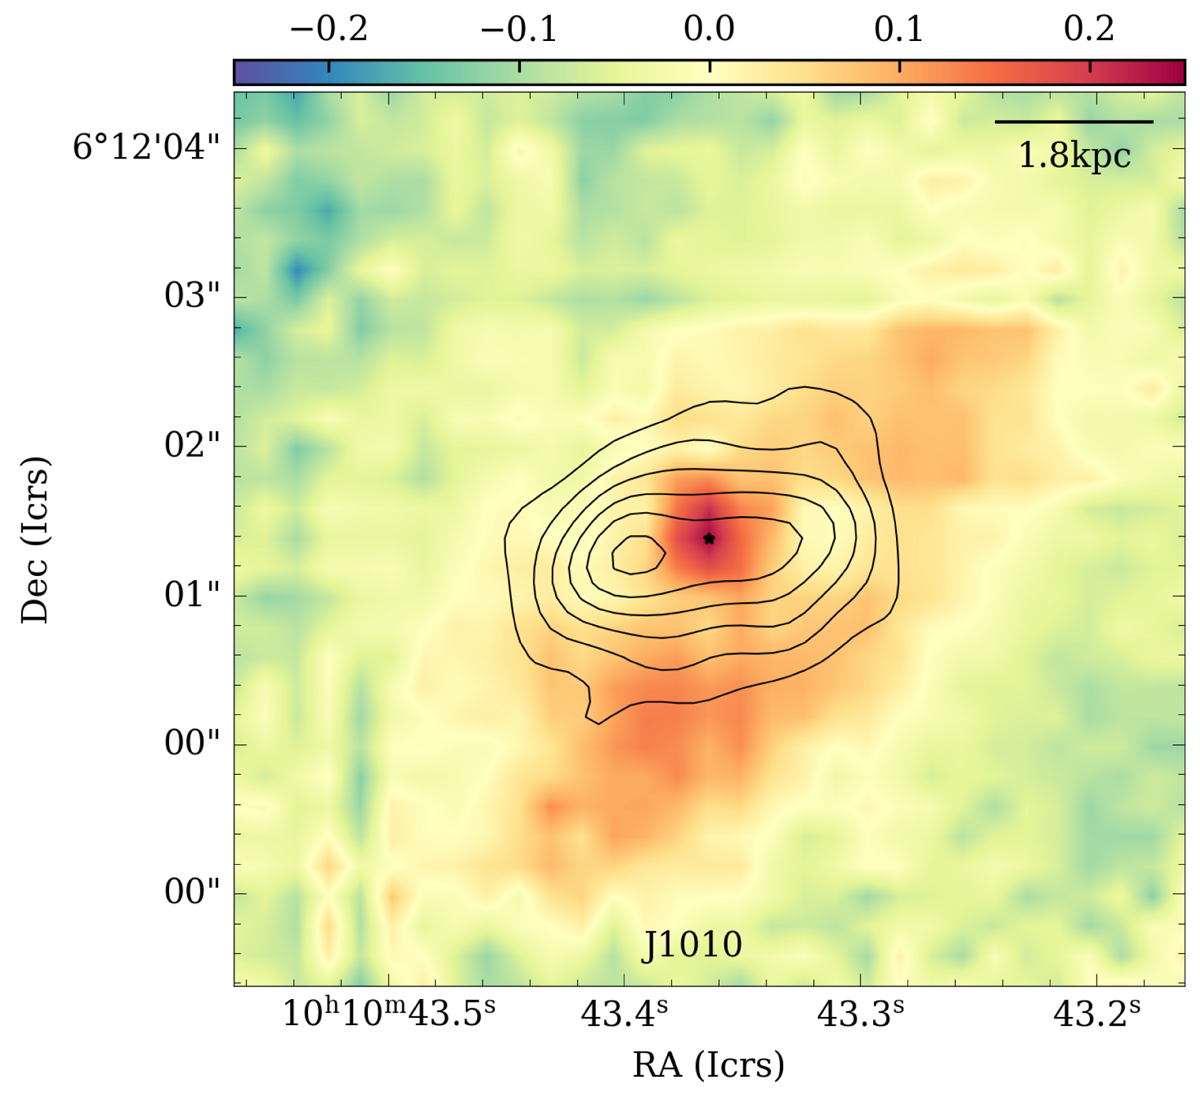
CO(2−1) contours (0.2, 0.35, 0.5, 0.65, 0.8, 0.95 times the peak of CO emission) of J1010 overlaid on the R-I color map, shown in color scale, derived from continuum images obtained from VLT/MUSE data (see Table 3), and centered at 6200 and 8500 Å. The star corresponds to the peak of the ALMA continuum image and the color map corresponds to the central 6″ × 6″. North is up and east to the left.
Current usage metrics show cumulative count of Article Views (full-text article views including HTML views, PDF and ePub downloads, according to the available data) and Abstracts Views on Vision4Press platform.
Data correspond to usage on the plateform after 2015. The current usage metrics is available 48-96 hours after online publication and is updated daily on week days.
Initial download of the metrics may take a while.