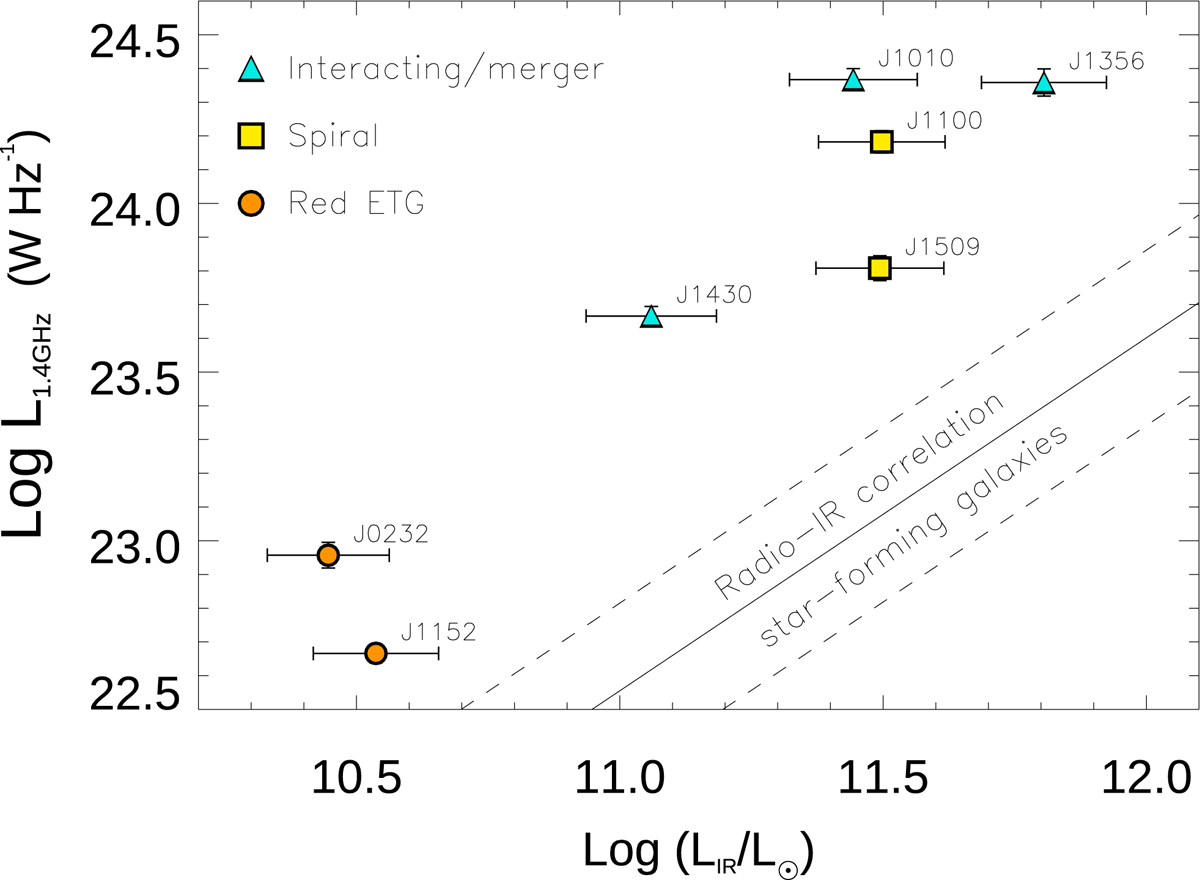
Fig. 2.
Download original image
Radio (1.4 GHz) versus IR luminosities (8–1000 μm) for the QSO2s in our sample. The radio-FIR correlation of star-forming galaxies from Bell (2003) is shown as a solid line (slope of 1.05 ± 0.04), with a correlation scatter of 0.26 dex. All the QSO2s in our sample show a radio excess. Different colors indicate whether the QSO2s are red ETGs, spirals, or interacting galaxies (see Table 2).
Current usage metrics show cumulative count of Article Views (full-text article views including HTML views, PDF and ePub downloads, according to the available data) and Abstracts Views on Vision4Press platform.
Data correspond to usage on the plateform after 2015. The current usage metrics is available 48-96 hours after online publication and is updated daily on week days.
Initial download of the metrics may take a while.