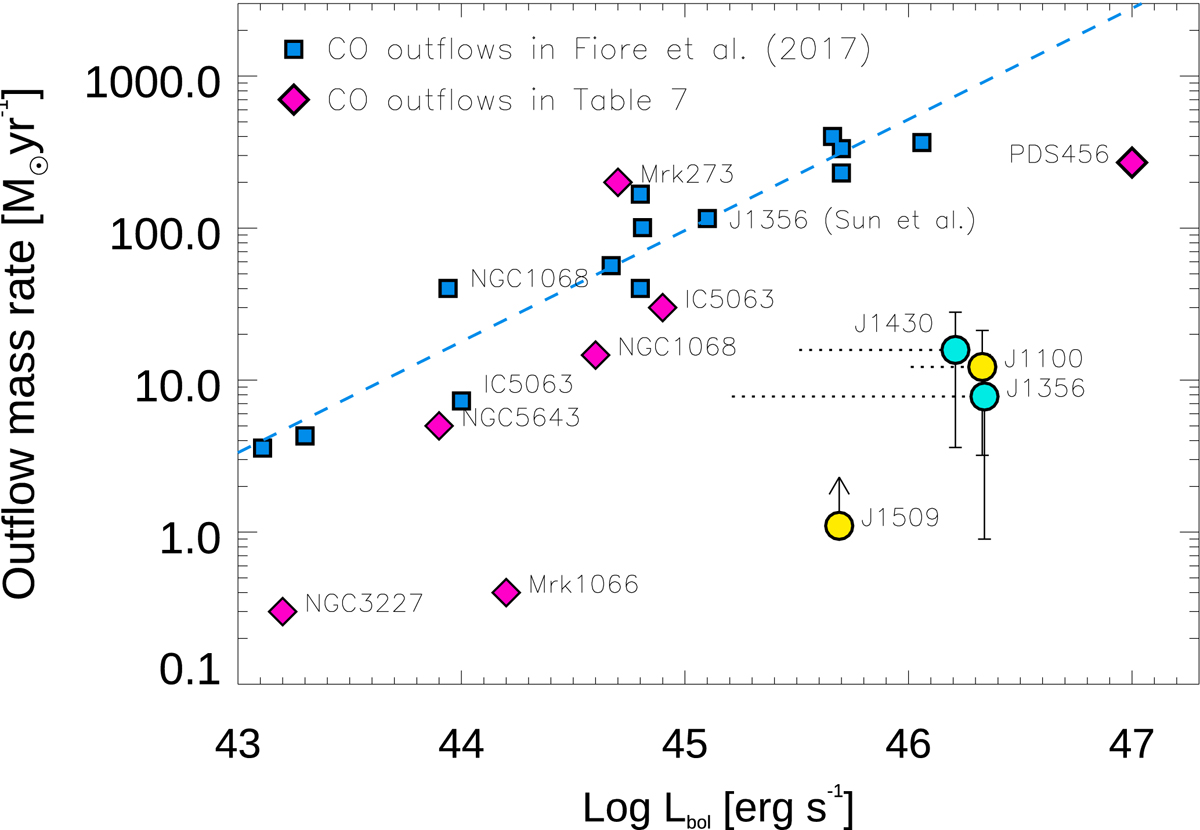
Fig. 18.

Download original image
Molecular mass outflow rate as a function of AGN luminosity. Circles correspond to the QSO2s. Horizontal dotted lines indicate the position that they would occupy if we use the more conservative Lbol values derived from SED fitting from Jarvis et al. (2019). Blue squares are the CO outflows of Seyferts and ULIRGs compiled by Fiore et al. (2017), but dividing the outflow rates by a factor of 3 to match our outflow geometry (see Eq. (1)). Blue dashed line is the linear fit of the blue squares. Pink diamonds are the galaxies included in Table 7 that are not in Fiore et al. (2017) except NGC 1068 and IC 5063, for which they report different AGN luminosities and outflow rates.
Current usage metrics show cumulative count of Article Views (full-text article views including HTML views, PDF and ePub downloads, according to the available data) and Abstracts Views on Vision4Press platform.
Data correspond to usage on the plateform after 2015. The current usage metrics is available 48-96 hours after online publication and is updated daily on week days.
Initial download of the metrics may take a while.


