Fig. 17.
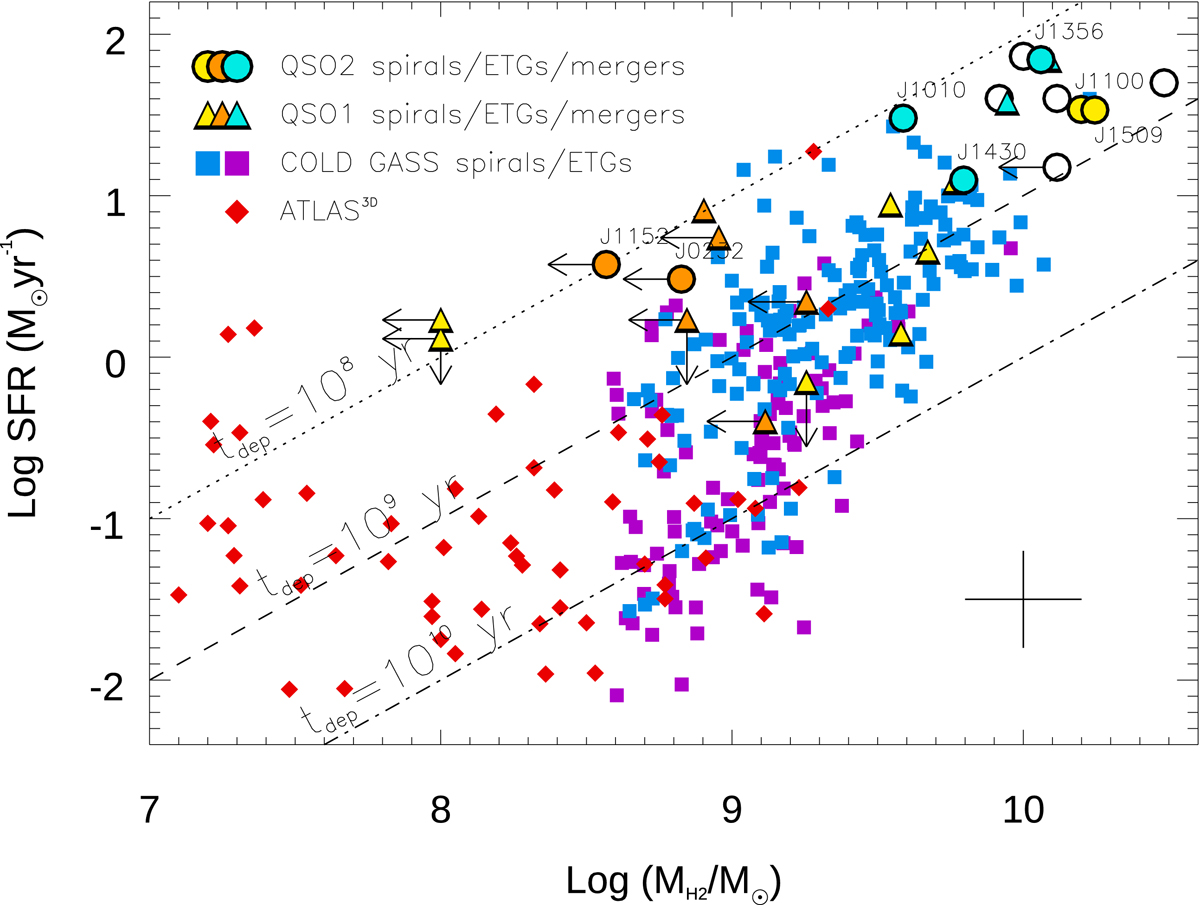
Download original image
SFR versus molecular gas masses for the QSO2s, shown as circles of the same colors as in Fig. 2. Average errors are indicated in the bottom right corner. Dotted, dashed and dot-dashed lines correspond to constant depletion times of 108, 109, and 1010 yr. Data from different samples are shown as follows: ATLAS3D are red diamonds, COLD GASS are blue/purple squares (disk/bulge-dominated galaxies), type-1 QSOs from Husemann et al. (2017) are triangles of the same colors as our QSO2s (orange=bulge-dominated, yellow=disk-dominated, light turquoise=major mergers), and QSO2s from Jarvis et al. (2020) are open circles.
Current usage metrics show cumulative count of Article Views (full-text article views including HTML views, PDF and ePub downloads, according to the available data) and Abstracts Views on Vision4Press platform.
Data correspond to usage on the plateform after 2015. The current usage metrics is available 48-96 hours after online publication and is updated daily on week days.
Initial download of the metrics may take a while.