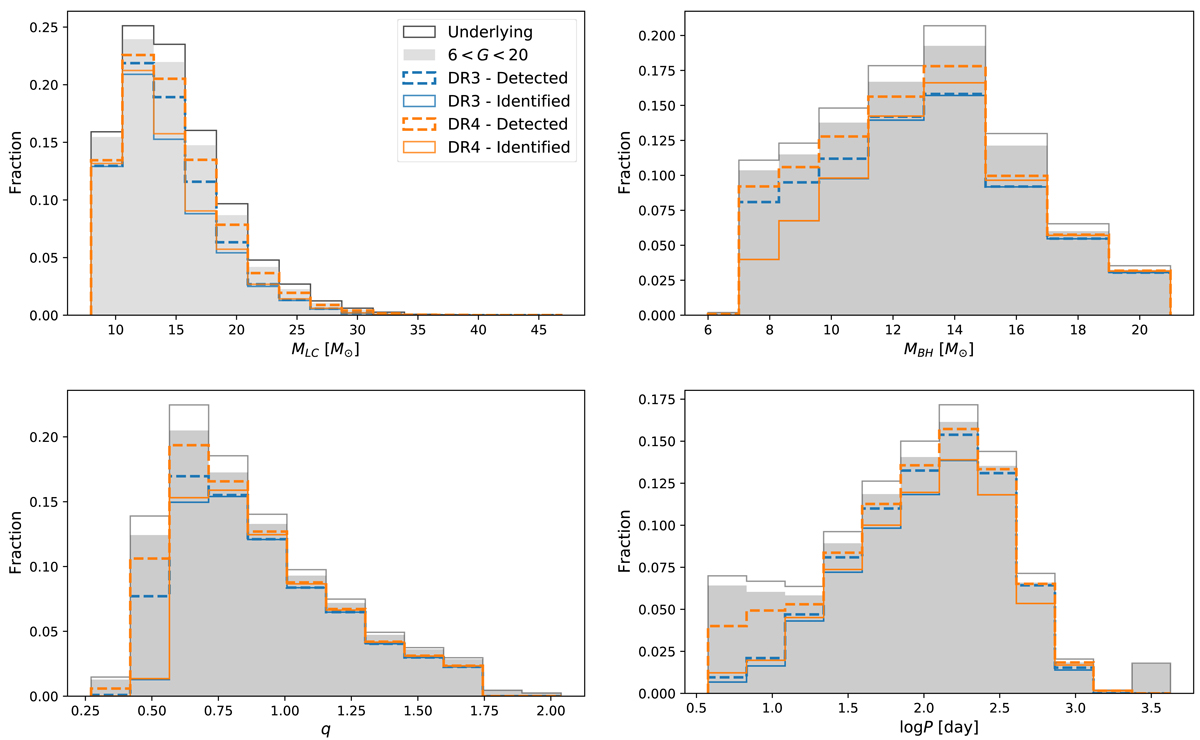
Fig. 8.
Download original image
Distribution of MLC (top left), MBH (top right), q (bottom left), and P (bottom right) in DR3 and DR4. In the legend, ‘Underlying’ is the distribution of all simulated OB+BH systems, ‘Detected’ are those systems detected as binaries by Gaia, and ‘Identified’ are Class III systems (i.e. confirmed OB+BH systems). The last systems are the observational distributions that can be expected to be constructed using the OB+BH systems identified in the respective data release.
Current usage metrics show cumulative count of Article Views (full-text article views including HTML views, PDF and ePub downloads, according to the available data) and Abstracts Views on Vision4Press platform.
Data correspond to usage on the plateform after 2015. The current usage metrics is available 48-96 hours after online publication and is updated daily on week days.
Initial download of the metrics may take a while.