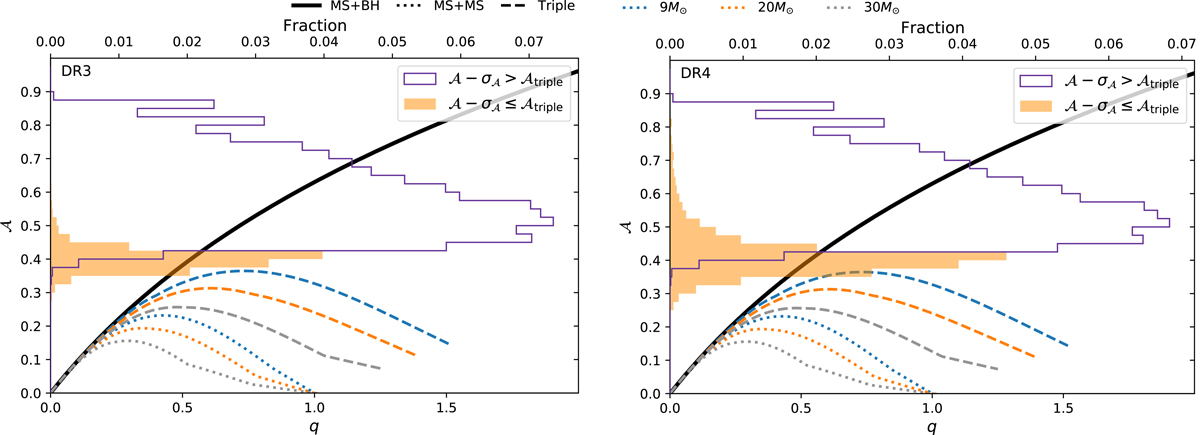
Fig. 7.
Download original image
Distribution of 𝒜 for the systems classified as a binary by Gaia. The left panel is for DR3 and the right panel for DR4. The curves are the same as in Fig. 4 (legend on top). Systems with 𝒜 − σ𝒜 > 𝒜triple (Class III) are represented by the purple open histogram, and systems with 𝒜 − σ𝒜 ≤ 𝒜triple (non-Class III) are shown with an orange filled histogram. Bins are 0.025 in width. The open histograms account for 88.7% and 82.3% of the total number of detected systems in the left and right panel, respectively.
Current usage metrics show cumulative count of Article Views (full-text article views including HTML views, PDF and ePub downloads, according to the available data) and Abstracts Views on Vision4Press platform.
Data correspond to usage on the plateform after 2015. The current usage metrics is available 48-96 hours after online publication and is updated daily on week days.
Initial download of the metrics may take a while.