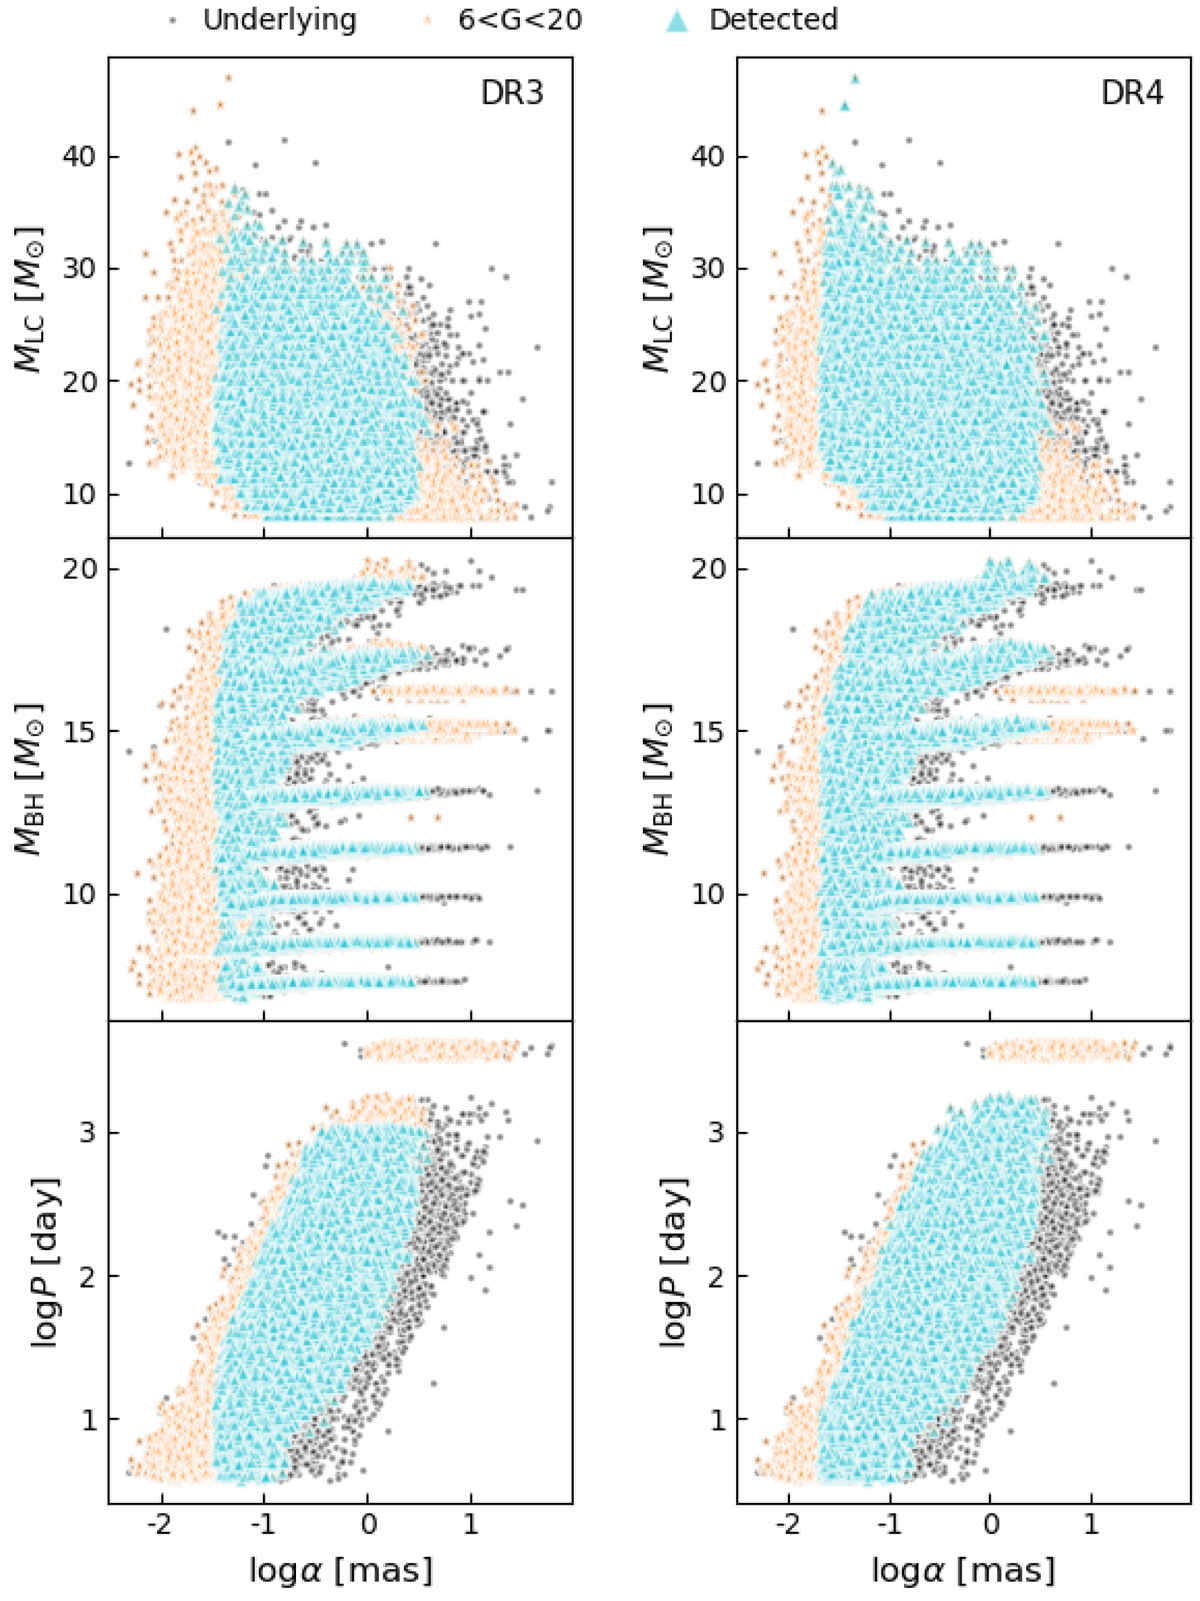
Fig. 6.
Download original image
Masses of the components and the periods as a function of the astrometric signal. The underlying distributions (those of Langer et al. 2020) are shown with black dots and overplotted with those systems having 6 < G < 20 (orange stars). On top is the subset of systems that are detected in the conservative case (i.e. α > 3σ and a period lower than the imposed upper limit; cyan triangles). The left panels are for DR3 and the right panels for DR4. The discrete BH masses come from the discrete main-sequence primary masses in the simulations of Langer et al. (2020).
Current usage metrics show cumulative count of Article Views (full-text article views including HTML views, PDF and ePub downloads, according to the available data) and Abstracts Views on Vision4Press platform.
Data correspond to usage on the plateform after 2015. The current usage metrics is available 48-96 hours after online publication and is updated daily on week days.
Initial download of the metrics may take a while.