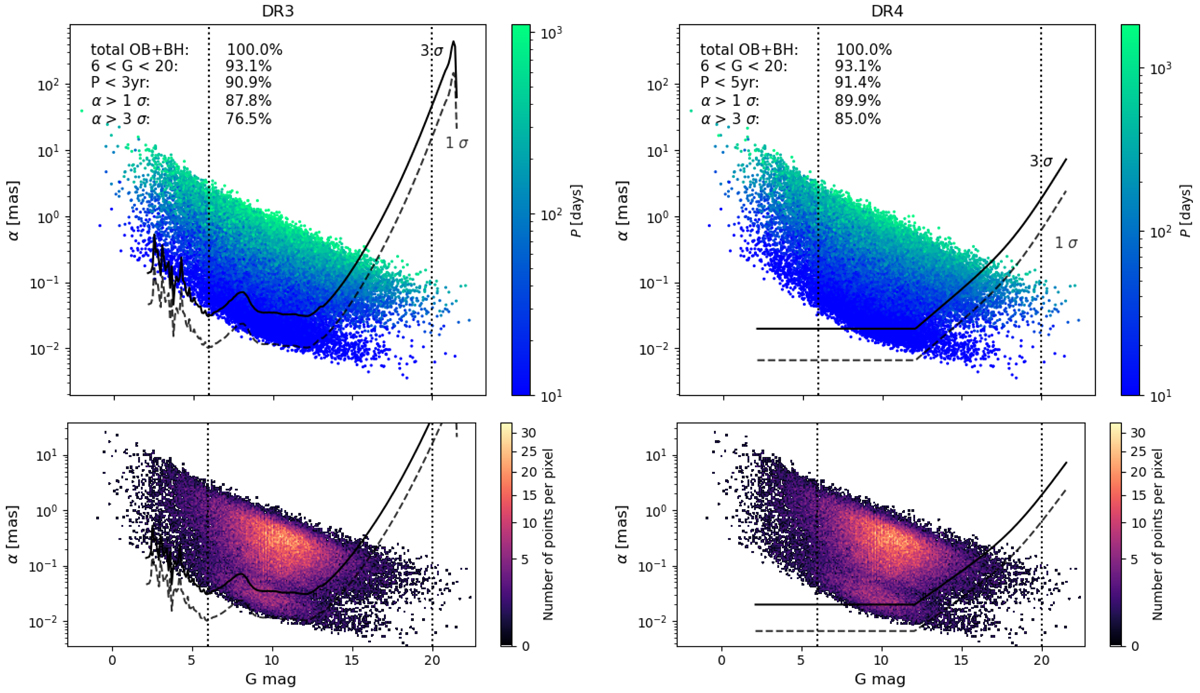
Fig. 5.

Download original image
Astrometric signal and magnitudes of the simulated OB+BH systems for DR3 (left) and for DR4 (right). The top panels are with a colour-coded period, and the bottom panels are density plots. Systems with periods longer than the upper limit of the respective data release are not shown. The vertical dotted lines in the panels show the limiting Gaia magnitude. From top to bottom, the meaning of the different entries in the legend is the fraction of OB+BH systems in total (by definition 100%), those with a G-band magnitude between 6 and 20 mag, those with a period below the upper limit, and those that have an astrometric signal larger than 1σ or 3σ, respectively. Systems that pass a certain criterion also need to have passed the criteria mentioned above it. The two higher-density regions in the bottom plot originate in the underlying period distribution related to the mass transfer event (see also the upper panel of Fig. 6 in Langer et al. 2020). Systems undergoing Case A mass transfer are found at shorter periods (the bottom region), and systems going through Case B mass transfer end up with higher periods (upper region).
Current usage metrics show cumulative count of Article Views (full-text article views including HTML views, PDF and ePub downloads, according to the available data) and Abstracts Views on Vision4Press platform.
Data correspond to usage on the plateform after 2015. The current usage metrics is available 48-96 hours after online publication and is updated daily on week days.
Initial download of the metrics may take a while.


