Fig. 10.
Download original image
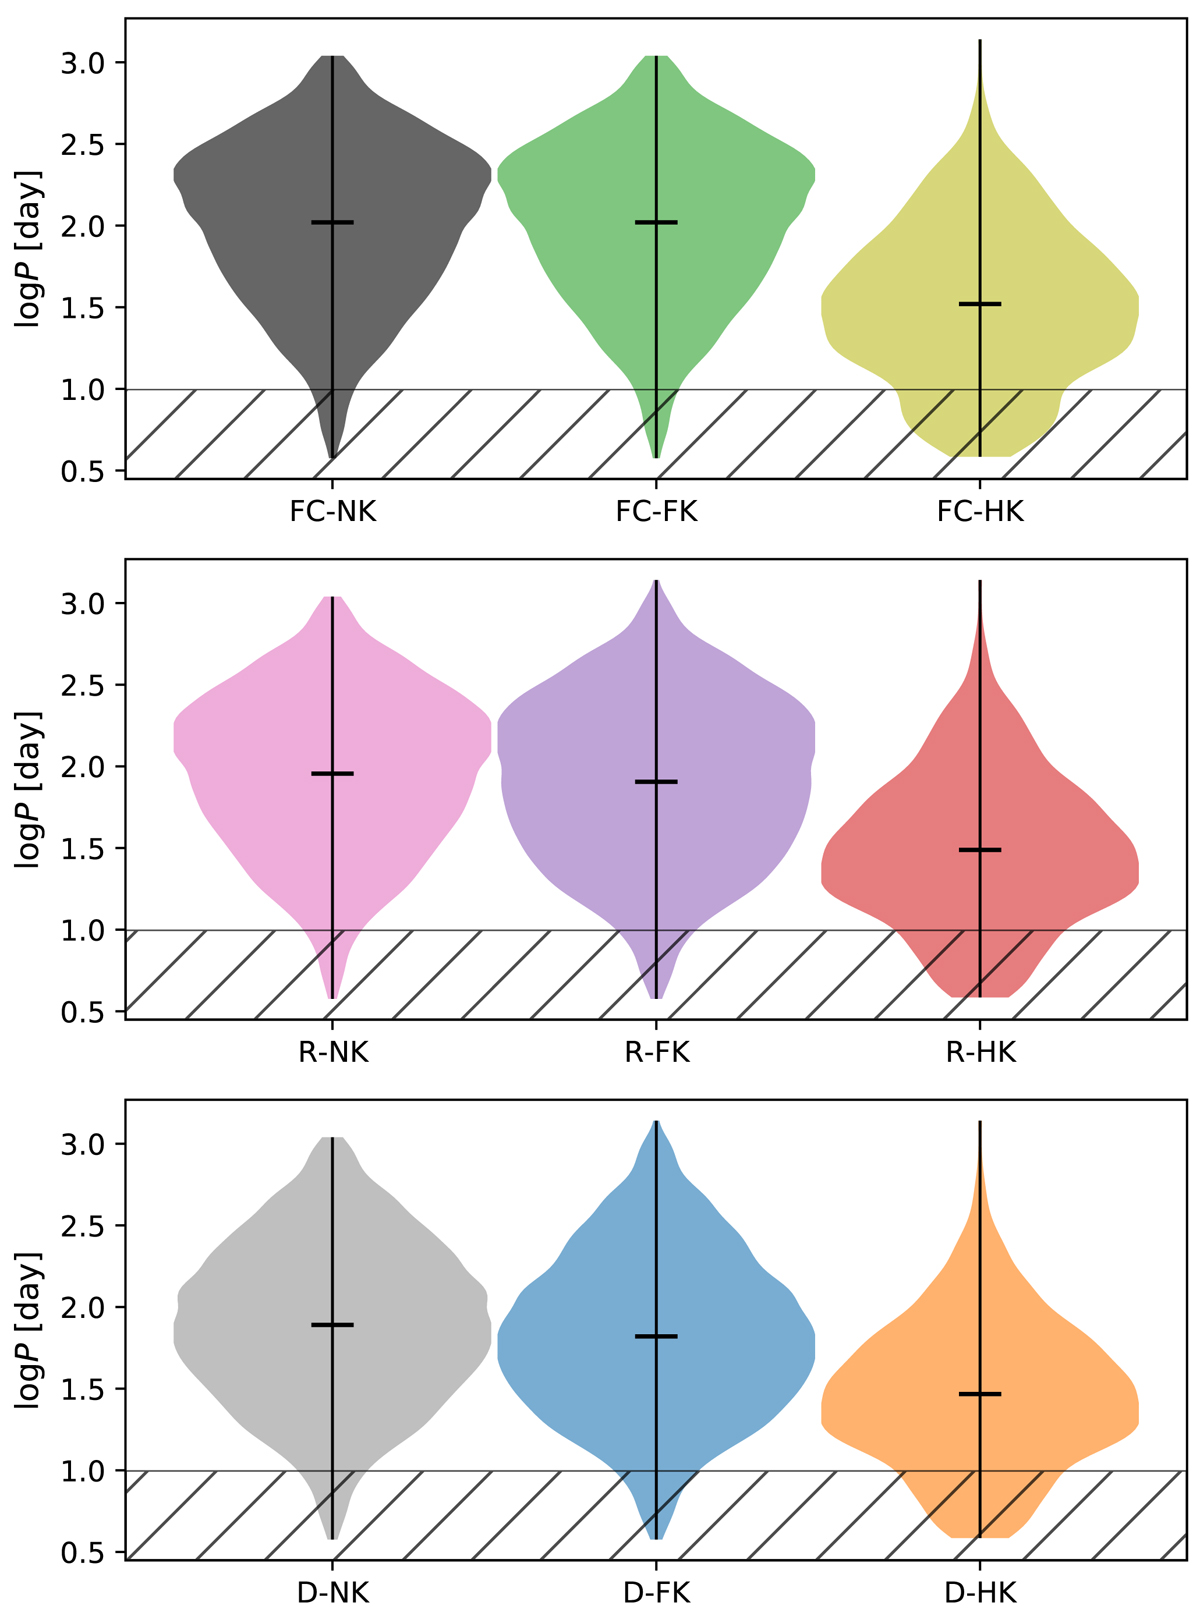
Violin plots for the periods of different BH-formation scenarios, indicated on the x axis. The filled regions are (vertical) probability density plots, which are mirrored over the vertical solid black line. The mean of the periods is indicated with a black horizontal bar. Hatched regions correspond to possible wind-fed or Roche-lobe overfilling X-ray binaries.
Current usage metrics show cumulative count of Article Views (full-text article views including HTML views, PDF and ePub downloads, according to the available data) and Abstracts Views on Vision4Press platform.
Data correspond to usage on the plateform after 2015. The current usage metrics is available 48-96 hours after online publication and is updated daily on week days.
Initial download of the metrics may take a while.