Fig. 7
Download original image
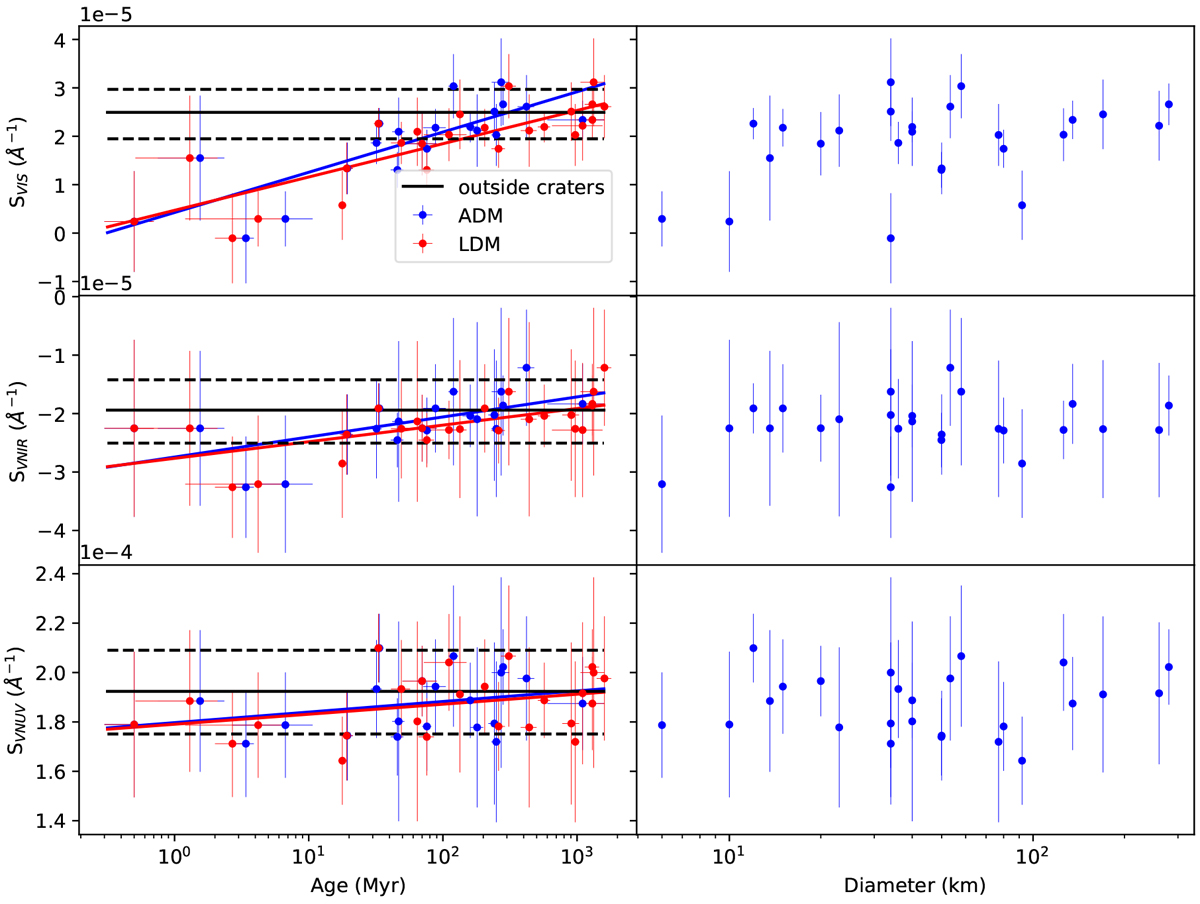
Relation between the median spectral slopes in the three different wavelength ranges described in Sect. 3 for craters on the surface of Ceres with their age (left) and size (right). The upper panel corresponds to SVIS, the central panel to SVNIR, and the lower panel to SVNUV. The represented ages are from two models: the asteroid derived model (in blue) and the lunar derived model (in red). The medianslope value of the region outside the craters is represented with a horizontal black line. The dashed lines mark the 16th and 85th percentiles. Solid lines correspond to the least squares fit for each model.
Current usage metrics show cumulative count of Article Views (full-text article views including HTML views, PDF and ePub downloads, according to the available data) and Abstracts Views on Vision4Press platform.
Data correspond to usage on the plateform after 2015. The current usage metrics is available 48-96 hours after online publication and is updated daily on week days.
Initial download of the metrics may take a while.