Fig. 3
Download original image
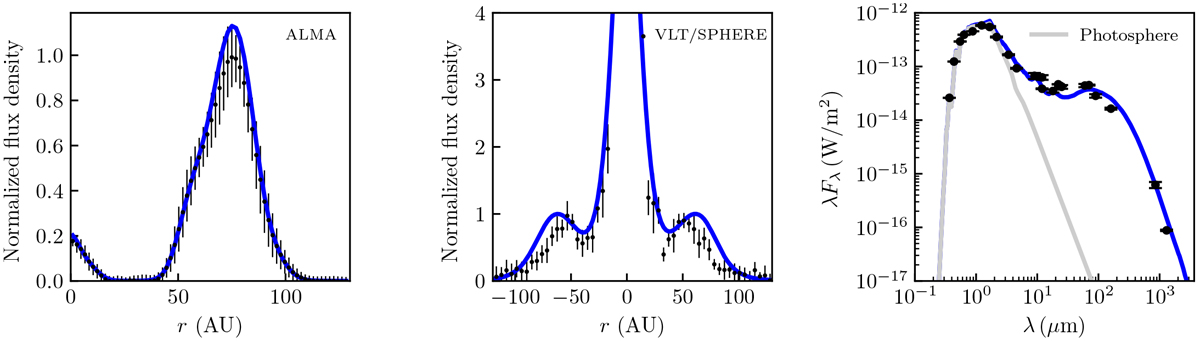
Left panel: azimuthally averaged radial brightness profile from the ALMA image (black dots) and from our model (blue line). Middle panel: radial cut along the major axis of the Qϕ frames (negative radial direction is along the red-shifted semi-major axis, which is nearly coincident with the south-east direction). Right panel: sepectral energy distribution towards PDS 70; black dots correspond to the source’s photometry and the blue line is our prediction.
Current usage metrics show cumulative count of Article Views (full-text article views including HTML views, PDF and ePub downloads, according to the available data) and Abstracts Views on Vision4Press platform.
Data correspond to usage on the plateform after 2015. The current usage metrics is available 48-96 hours after online publication and is updated daily on week days.
Initial download of the metrics may take a while.