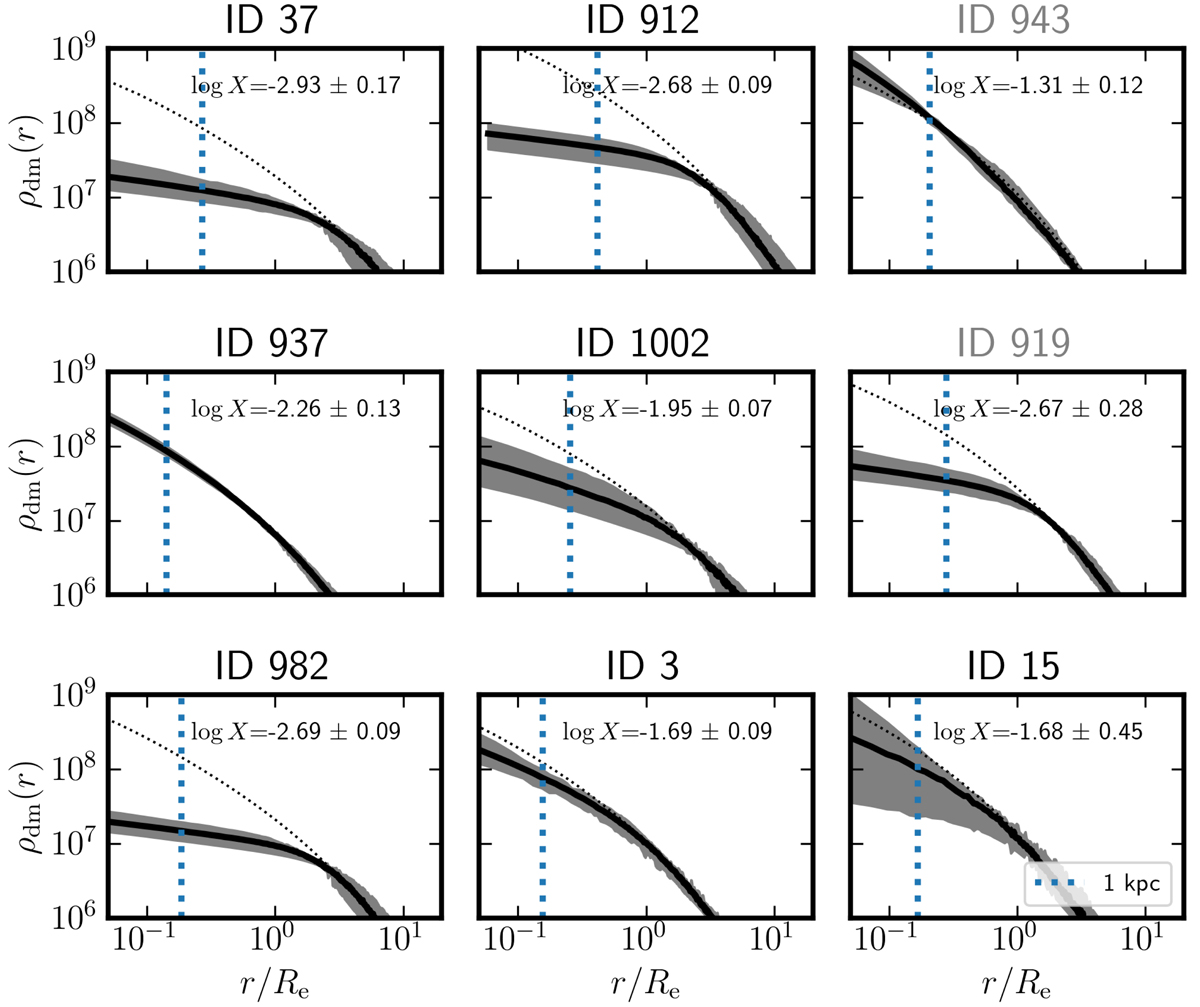
Fig. 9.
Download original image
DM density profiles in M⊙/kpc3. Each panel show ρdm(r) as a function of r/Re obtained from our disk-halo decompositions (Fig. 4). The stellar-to-halo-mass ratio (log X ≡ log M⋆/Mvir) is indicated. The gray bands represent the 95% confidence interval and the dotted lines represent NFW profiles. The vertical dotted lines represent the 1 kpc physical scale, corresponding to ≈1 MUSE spaxel, and indicates the lower limit of our constraints.
Current usage metrics show cumulative count of Article Views (full-text article views including HTML views, PDF and ePub downloads, according to the available data) and Abstracts Views on Vision4Press platform.
Data correspond to usage on the plateform after 2015. The current usage metrics is available 48-96 hours after online publication and is updated daily on week days.
Initial download of the metrics may take a while.