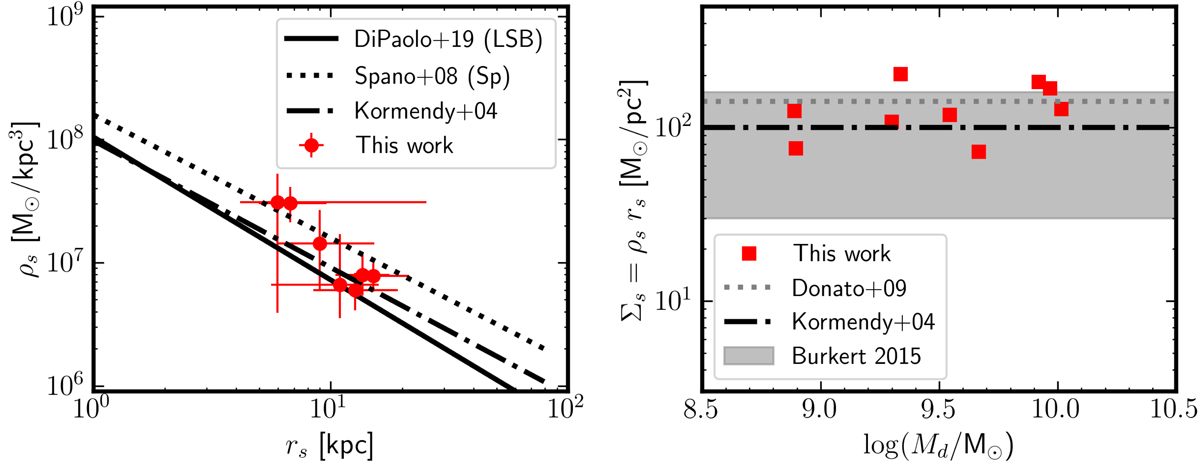
Fig. 8.
Download original image
Halo scale radius-density relation at z = 1. Left: ρs − rs scaling relation for the galaxies shown in Fig. 7. The error bars are 95% confidence intervals (2σ). For comparison, the anticorrelation of Kormendy & Freeman (2004), Spano et al. (2008) and Di Paolo et al. (2019) are shown. Right: DM surface density (Σs ≡ ρs rs) as a function of galaxy mass. The anticorrelation in the left panel implies a constant DM surface density. The gray band represents the range of surface densities from Burkert (2015) for dwarfs. The constant densities of Kormendy & Freeman (2004) and Donato et al. (2009) are shown as the dotted, dot-dashed lines, respectively.
Current usage metrics show cumulative count of Article Views (full-text article views including HTML views, PDF and ePub downloads, according to the available data) and Abstracts Views on Vision4Press platform.
Data correspond to usage on the plateform after 2015. The current usage metrics is available 48-96 hours after online publication and is updated daily on week days.
Initial download of the metrics may take a while.