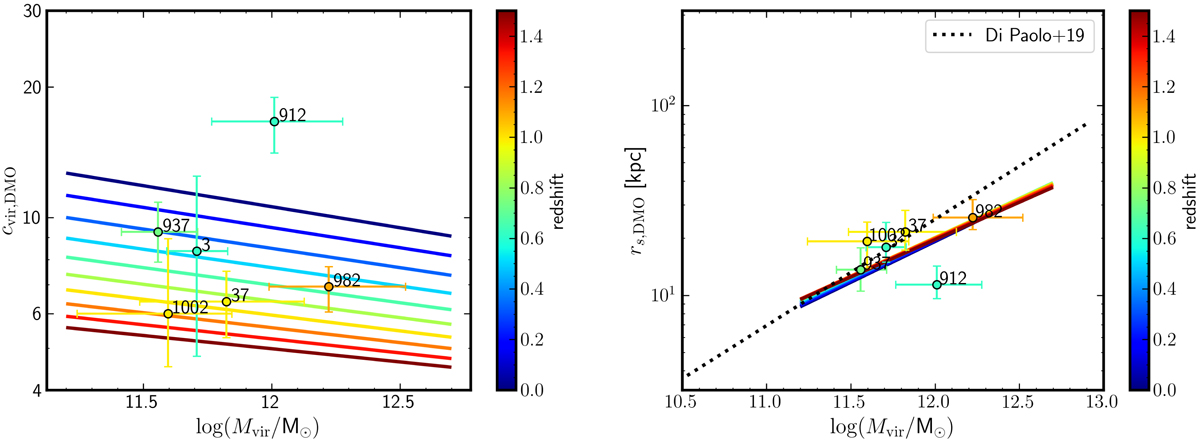
Fig. 7.
Download original image
Size of DM cores. Left: halo concentration-halo mass relation. The concentrations cvir for z ≃ 1 SFGs, derived from our 3D modeling of the [O II] rotation curves, are converted to a DM-only NFW equivalent cvir, DMO (see text). Right: DM core size rs, DMO ≡ Rvir/cvir, DMO in kpc as a function of halo mass. The dotted line represents the observed core-mass scaling relation for z = 0 LSBs from Di Paolo et al. (2019) (see text). In both panels, the solid lines represent the cvir − Mvir relation predicted by Dutton & Macciò (2014) for DM halos, color-coded by redshift. The error bars are 95% confidence intervals (2σ) and color-coded also by the galaxy redshift.
Current usage metrics show cumulative count of Article Views (full-text article views including HTML views, PDF and ePub downloads, according to the available data) and Abstracts Views on Vision4Press platform.
Data correspond to usage on the plateform after 2015. The current usage metrics is available 48-96 hours after online publication and is updated daily on week days.
Initial download of the metrics may take a while.