Fig. 6.

Download original image
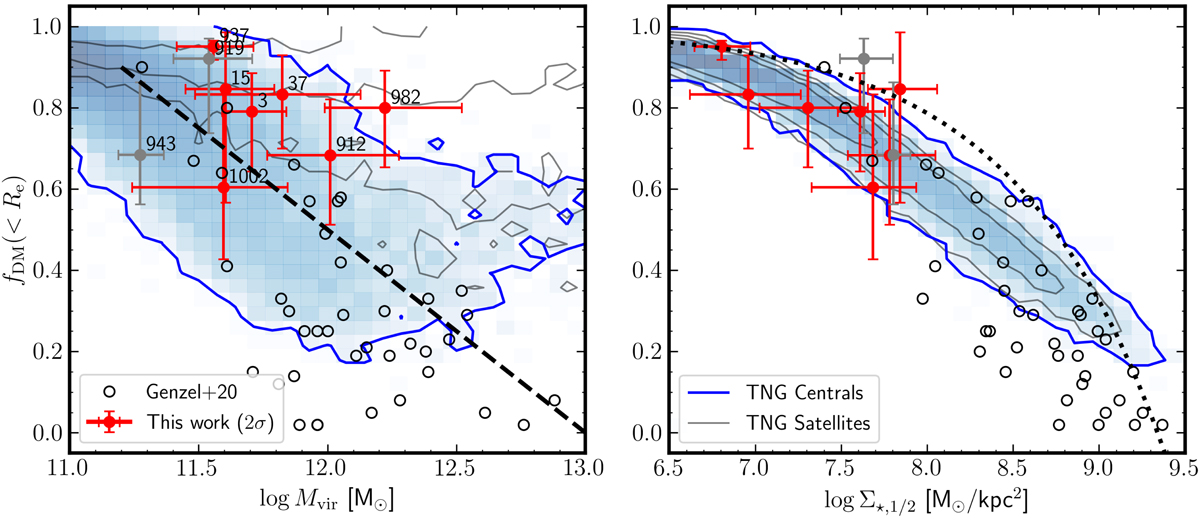
DM fractions for our SFGs. Left: DM fractions within the half-light radius Re, fDM(< Re), as a function of halo mass, Mvir. The dashed line represent the downward trend of Genzel et al. (2020). Right: DM fractions within Re as a function of stellar mass surface density Σ⋆, 1/2 within Re. In both panels, the error bars from our data are 95% confidence intervals, and the open circles show the sample of Genzel et al. (2020). The shaded (blue contours) histogram shows the location of SFGs in the TNG100 simulations for z = 1 central SFGs, while the gray contours show the satellites. The dotted line represents the toy model derived from the TF relation (Eq. (9)).
Current usage metrics show cumulative count of Article Views (full-text article views including HTML views, PDF and ePub downloads, according to the available data) and Abstracts Views on Vision4Press platform.
Data correspond to usage on the plateform after 2015. The current usage metrics is available 48-96 hours after online publication and is updated daily on week days.
Initial download of the metrics may take a while.


