Fig. 5.
Download original image
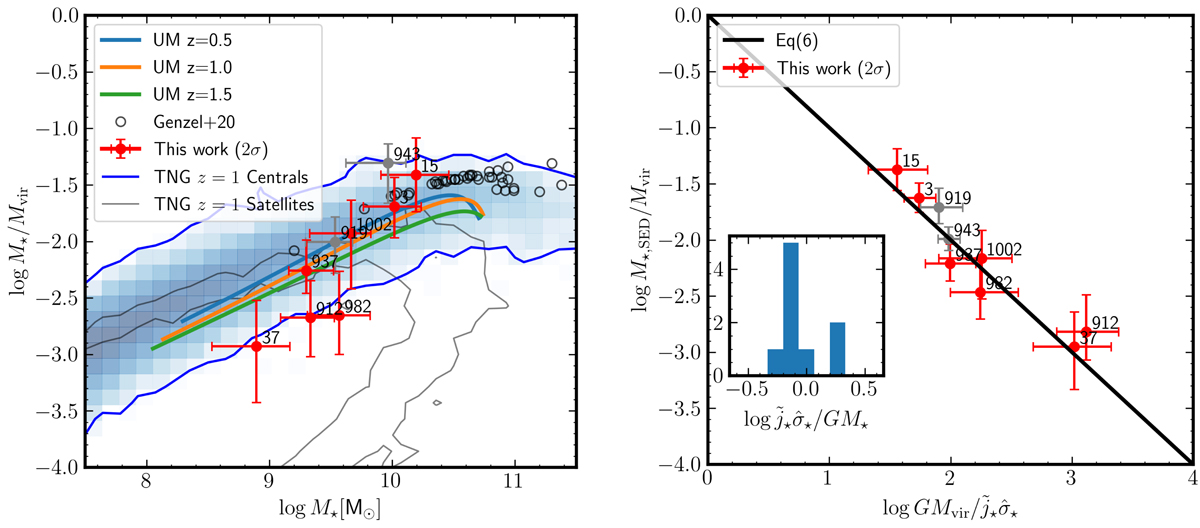
Total stellar-to-halo fraction. Left: total stellar-to-halo fractions M⋆/Mvir as a function of the stellar mass M⋆ obtained from our 3D fits. The error bars from our data are 95% confidence intervals, and the open circles show the sample of Genzel et al. (2020). The shaded (blue contours) histogram shows the location of SFGs in the TNG simulations for z = 1 centrals, while the gray contours show the satellites. The colored lines show the Behroozi et al. (2019) relation inferred from semi-empirical modeling at redshifts z = 0.5, 1.0, 1.5, respectively. Right: total stellar-to-halo fractions M⋆/Mvir as a function of GMvir/j⋆σ⋆ (Eq. (7)) for the galaxies in our sample. The inset histogram shows that the sample has ![]() (≡⟨Q⋆⟩, Eq. (6)), see text.
(≡⟨Q⋆⟩, Eq. (6)), see text.
Current usage metrics show cumulative count of Article Views (full-text article views including HTML views, PDF and ePub downloads, according to the available data) and Abstracts Views on Vision4Press platform.
Data correspond to usage on the plateform after 2015. The current usage metrics is available 48-96 hours after online publication and is updated daily on week days.
Initial download of the metrics may take a while.