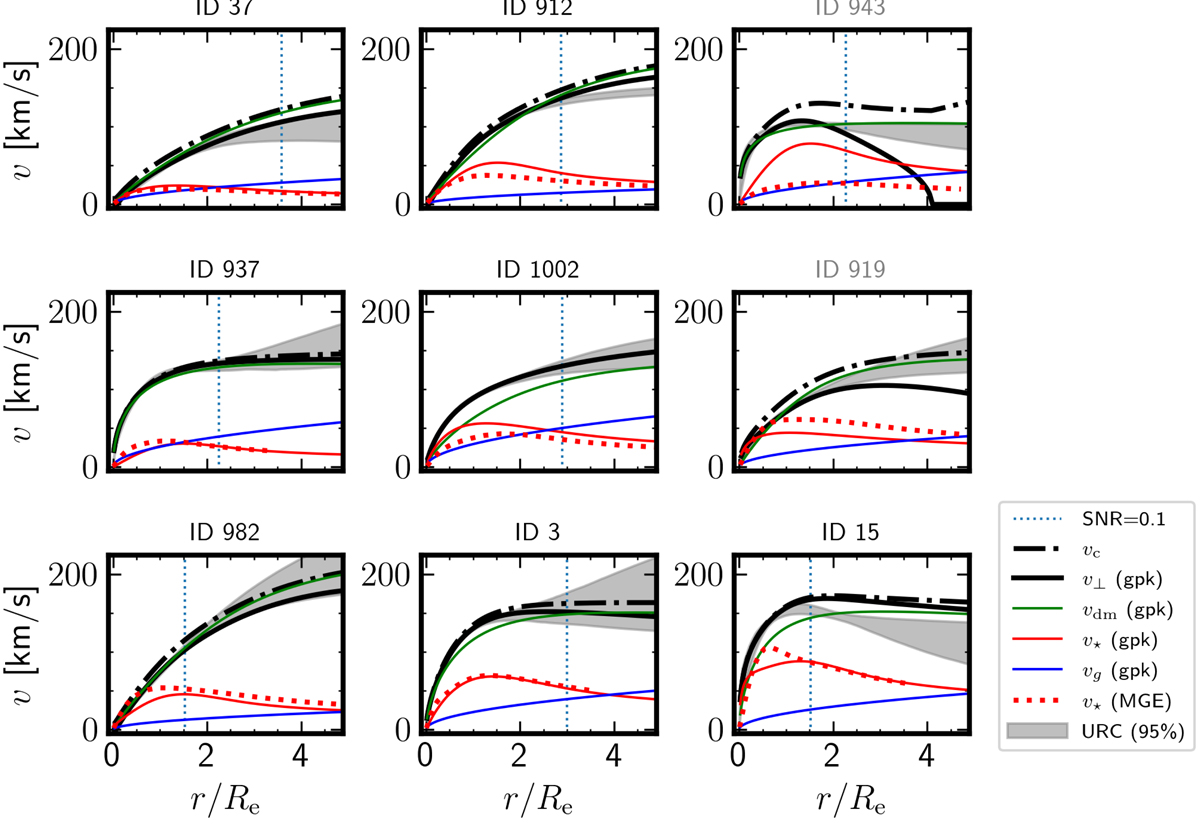
Fig. 4.
Download original image
Disk-halo decompositions for the nine galaxies in our sample (ordered by increasing M⋆). The solid black line represents the total rotation velocity v⊥(r). All velocities are ‘intrinsic’, that is corrected for inclination and instrumental effects. The dot-dashed line represents the circular velocity vc(r), that is v⊥(r) corrected for asymmetric drift. The gray band represents the intrinsic universal rotation curve (URC) using the parameterization of PSS96 as in Fig. 2. The solid red (blue) line represents the stellar (gas) component v⋆(r) obtained from GALPAK3D modeling of the MUSE [O II] data. The dotted red line represents the stellar component obtained using a MGE decomposition of the HST/F160W stellar continuum images. The green line represents the DM component. The vertical dotted lines are as in Fig. 2.
Current usage metrics show cumulative count of Article Views (full-text article views including HTML views, PDF and ePub downloads, according to the available data) and Abstracts Views on Vision4Press platform.
Data correspond to usage on the plateform after 2015. The current usage metrics is available 48-96 hours after online publication and is updated daily on week days.
Initial download of the metrics may take a while.