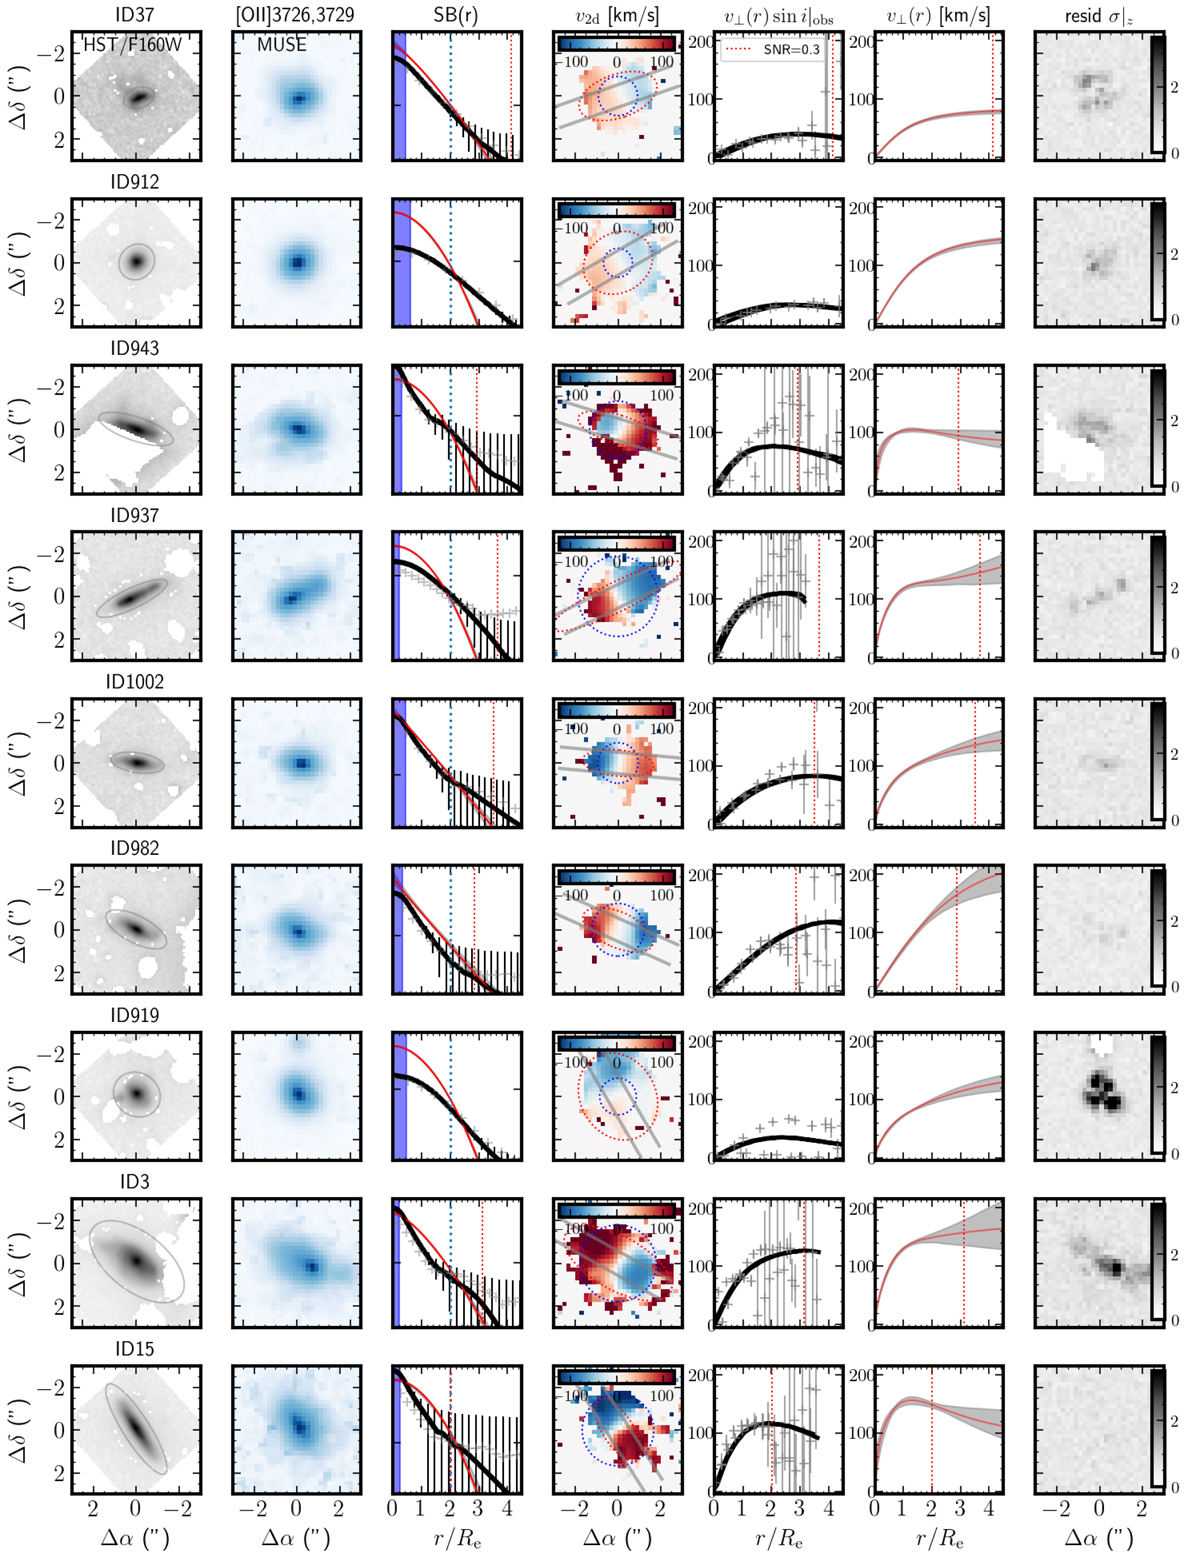
Fig. 2.

Download original image
Morpho-kinematics of each SFG. The columns shows (from left to right) the stellar continuum from HST/F160W, the [O II] flux map from MUSE, the [O II] surface brightness profile (SB(r)), the observed projected velocity field (v2d), the observed 1d velocity profile v⊥ sin i, the intrinsic (i.e., deprojected, corrected for beam smearing) modeled rotation curve (v⊥) using the URC model of PSS96 (see Sect. 3.1), and the residuals map obtained from the residual cube (see text). The red solid lines show the intrinsic SB(r) and v⊥ model. The solid black lines show the convolved SB profile and modeled 1d velocity profile. The gray symbols represent the data extracted from the flux and velocity maps. The blue vertical dotted lines represent 2 Re, while the red dotted lines show the radius at which the S/N per spaxel reaches 0.3.
Current usage metrics show cumulative count of Article Views (full-text article views including HTML views, PDF and ePub downloads, according to the available data) and Abstracts Views on Vision4Press platform.
Data correspond to usage on the plateform after 2015. The current usage metrics is available 48-96 hours after online publication and is updated daily on week days.
Initial download of the metrics may take a while.


