Fig. 9.
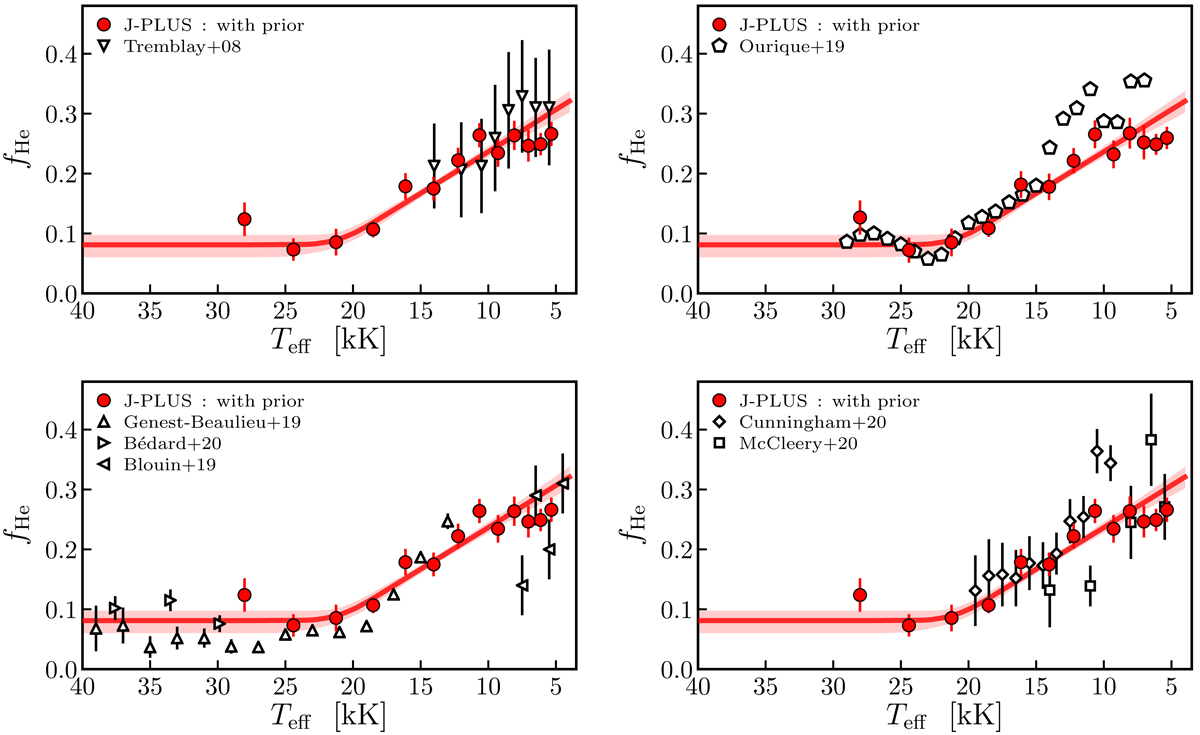
Download original image
Fraction of He-dominated white dwarfs (fHe) as a function of effective temperature (Teff) from the literature and J-PLUS. We split the comparison in four panels to improve visualization. In all panels, the red solid line is the best-fitting spectral evolution estimated from J-PLUS photometry. The red area encloses 68% of the solutions. The red dots show the J-PLUS values obtained from the posterior estimated with the spectral evolution prior applied. The black symbols labeled in the panels show results from the literature.
Current usage metrics show cumulative count of Article Views (full-text article views including HTML views, PDF and ePub downloads, according to the available data) and Abstracts Views on Vision4Press platform.
Data correspond to usage on the plateform after 2015. The current usage metrics is available 48-96 hours after online publication and is updated daily on week days.
Initial download of the metrics may take a while.