Fig. 5.
Download original image
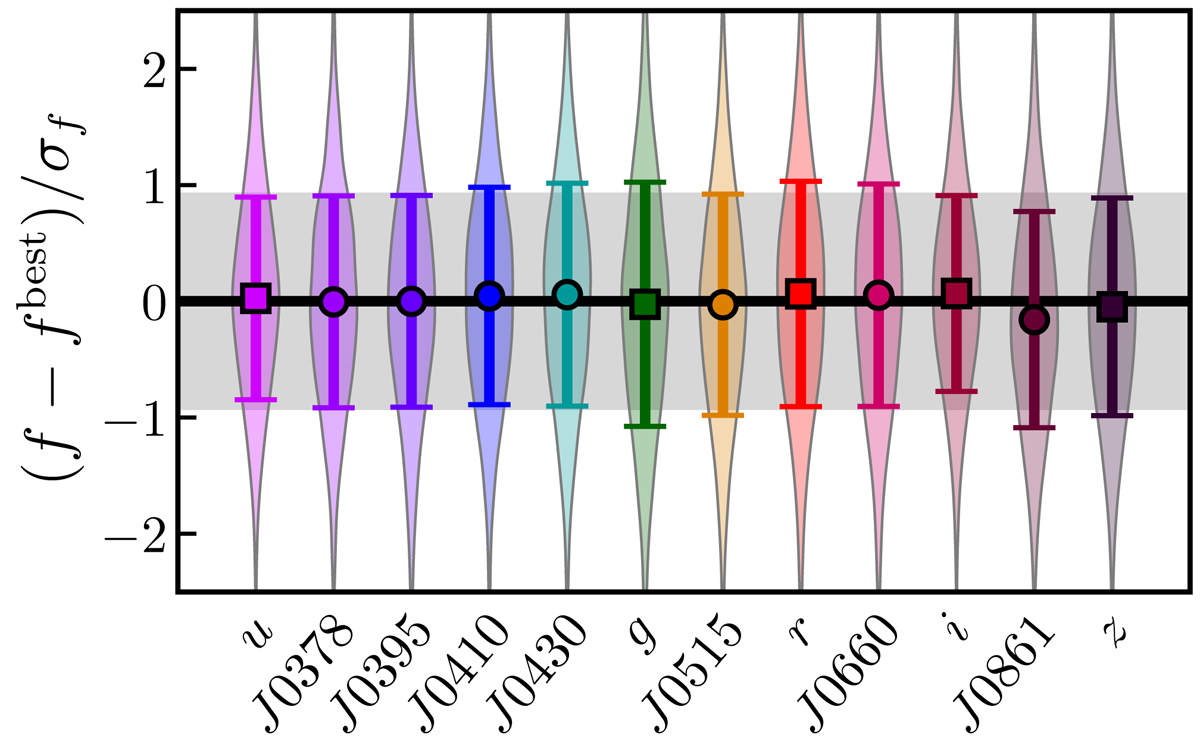
Distribution of the observed flux minus the best-fitting flux normalized by the photometric error. The squares (broad bands) and circles (medium bands) show the median and the dispersion of the distribution, depicted with the violin plots. The black solid line marks a zero difference, and the gray area shows the ±0.91 value expected for the dispersion.
Current usage metrics show cumulative count of Article Views (full-text article views including HTML views, PDF and ePub downloads, according to the available data) and Abstracts Views on Vision4Press platform.
Data correspond to usage on the plateform after 2015. The current usage metrics is available 48-96 hours after online publication and is updated daily on week days.
Initial download of the metrics may take a while.