Fig. 4.
Download original image
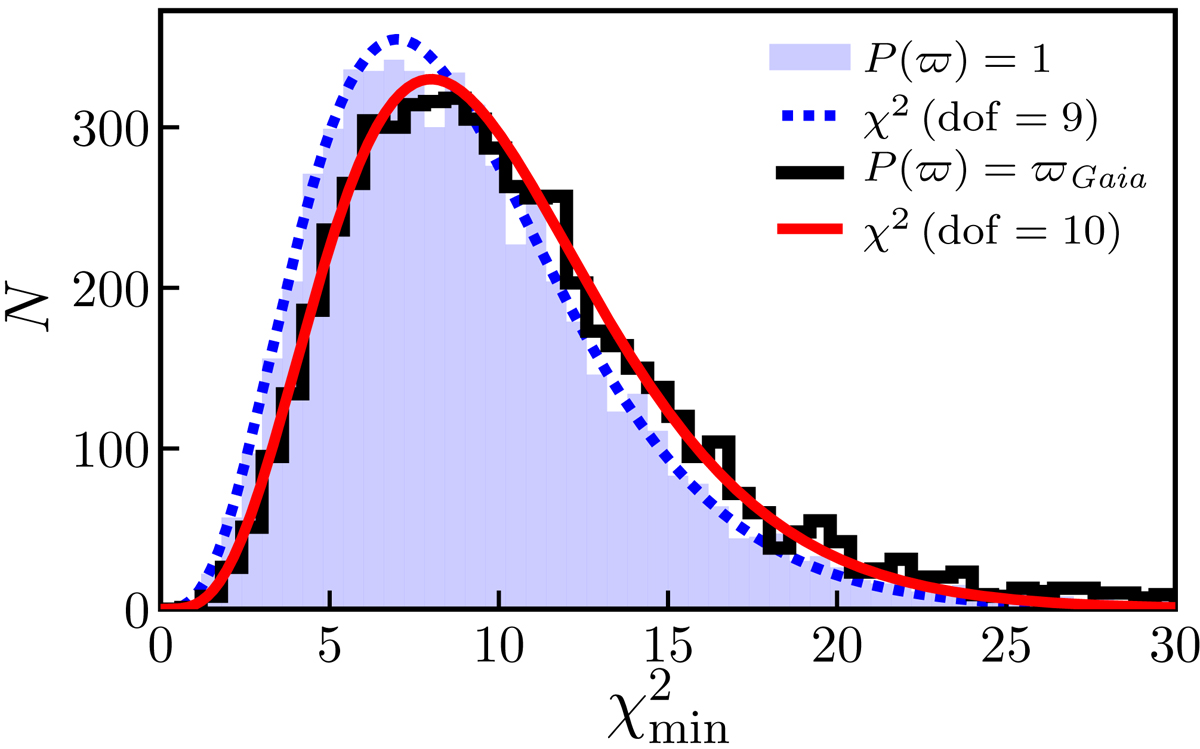
Distribution of ![]() for the white dwarf sample. The open black histogram represents the solutions when the Gaia EDR3 parallax was used as prior, and the blue solid histogram shows when no prior in parallax was used in the fitting. The red solid and blue dotted lines mark the expected χ2 distribution for 10 and 9 degrees of freedom, respectively.
for the white dwarf sample. The open black histogram represents the solutions when the Gaia EDR3 parallax was used as prior, and the blue solid histogram shows when no prior in parallax was used in the fitting. The red solid and blue dotted lines mark the expected χ2 distribution for 10 and 9 degrees of freedom, respectively.
Current usage metrics show cumulative count of Article Views (full-text article views including HTML views, PDF and ePub downloads, according to the available data) and Abstracts Views on Vision4Press platform.
Data correspond to usage on the plateform after 2015. The current usage metrics is available 48-96 hours after online publication and is updated daily on week days.
Initial download of the metrics may take a while.