Fig. 3.
Download original image
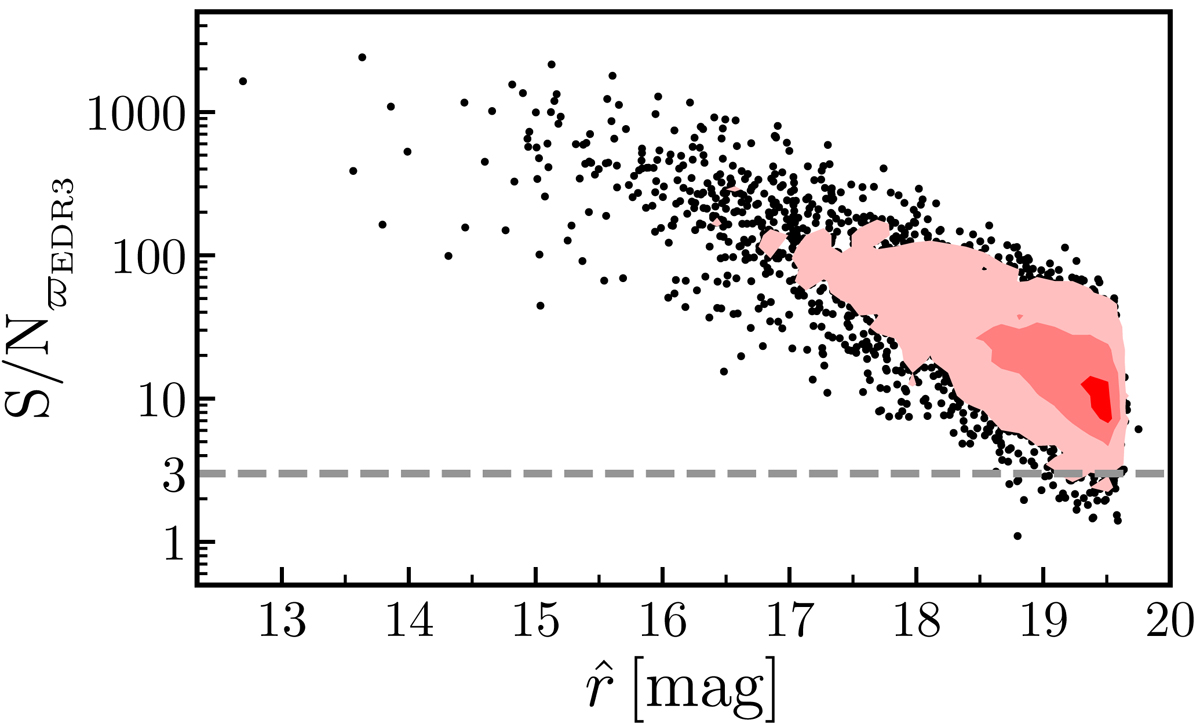
Signal-to-noise ratio in the Gaia EDR3 parallax (S/NϖEDR3) as a function of the de-reddened r-band apparent magnitude (![]() ) for the final white dwarf sample. The black dots show individual measurements. The red areas from lighter to darker enclose 90%, 50%, and 10% of the sources, respectively. The gray dashed line marks S/NϖEDR3 = 3.
) for the final white dwarf sample. The black dots show individual measurements. The red areas from lighter to darker enclose 90%, 50%, and 10% of the sources, respectively. The gray dashed line marks S/NϖEDR3 = 3.
Current usage metrics show cumulative count of Article Views (full-text article views including HTML views, PDF and ePub downloads, according to the available data) and Abstracts Views on Vision4Press platform.
Data correspond to usage on the plateform after 2015. The current usage metrics is available 48-96 hours after online publication and is updated daily on week days.
Initial download of the metrics may take a while.