Free Access
Fig. 13.
Download original image
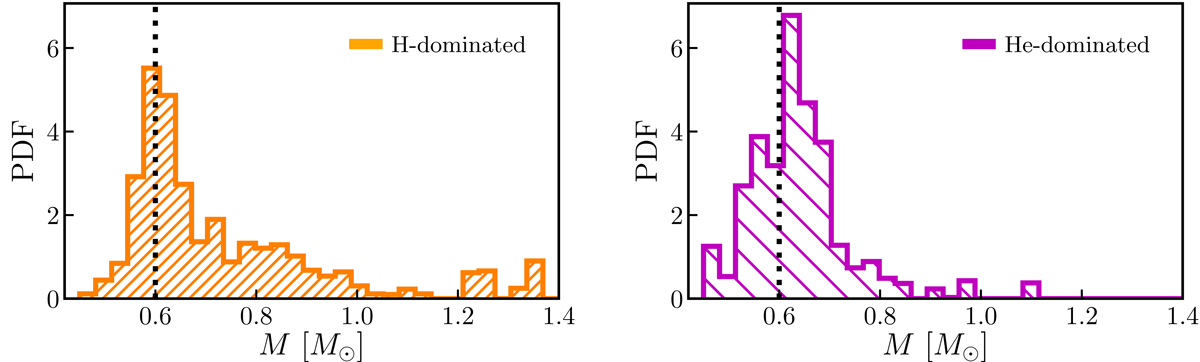
White dwarf mass distribution at d ≤ 100 pc for sources with M > 0.45 M⊙ and Teff > 6000 K. Left panel: normalized histogram weighted by pH. Right panel: normalized histogram weighted by (1 − pH). The dotted line in both panels marks a mass of M = 0.6 M⊙ for reference.
Current usage metrics show cumulative count of Article Views (full-text article views including HTML views, PDF and ePub downloads, according to the available data) and Abstracts Views on Vision4Press platform.
Data correspond to usage on the plateform after 2015. The current usage metrics is available 48-96 hours after online publication and is updated daily on week days.
Initial download of the metrics may take a while.