Fig. 12.
Download original image
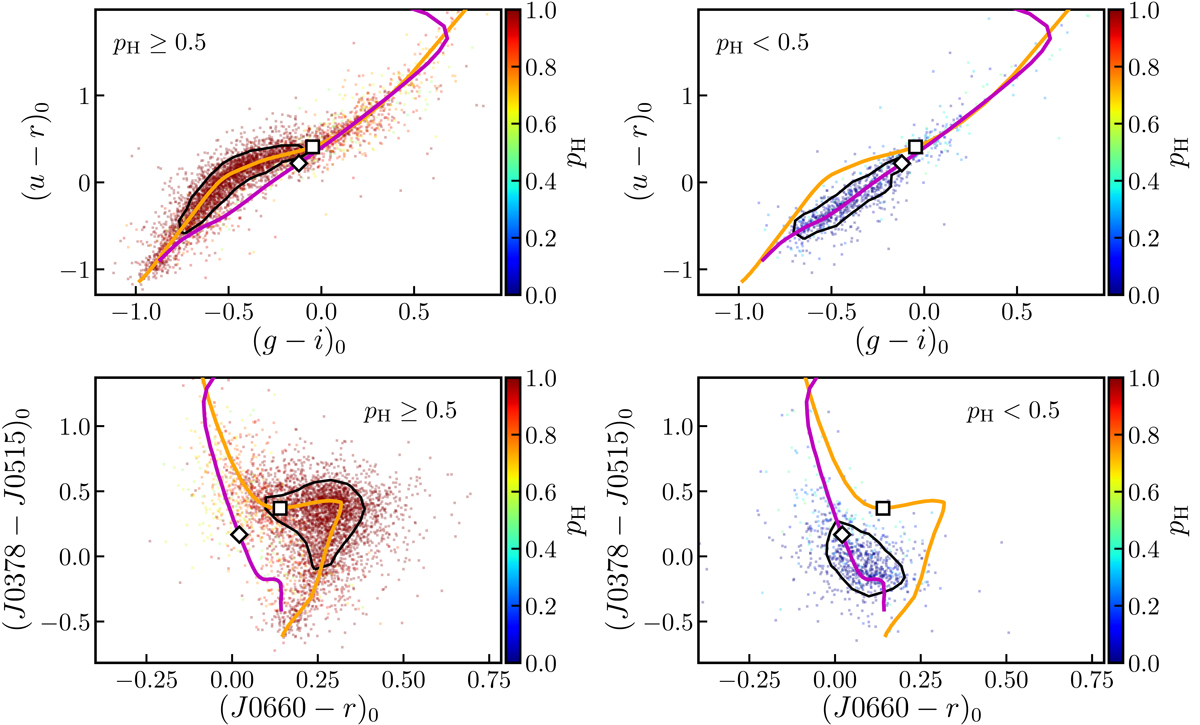
(u − r)0 versus (g − i)0 (top panels) and (J0378 − J0515)0 versus (J0660 − r)0 (bottom panels) color–color diagrams for white dwarfs with S/N > 3 in J-PLUS photometry (5379 sources). In both panels, the orange and purple lines show the theoretical loci for H-dominated and He-dominated atmospheres, respectively. The black contour enclose 50% of the sources in each panel. The square and the diamond mark the colors for a H- and a He-dominated white dwarf, respectively, with Teff = 8500 K and log g = 8 dex. The color scale shows the probability of having a H-dominated atmosphere, pH. Left panels: color–color diagrams for the 4470 sources with pH ≥ 0.5. Right panels: color–color diagrams for the 909 sources with pH < 0.5.
Current usage metrics show cumulative count of Article Views (full-text article views including HTML views, PDF and ePub downloads, according to the available data) and Abstracts Views on Vision4Press platform.
Data correspond to usage on the plateform after 2015. The current usage metrics is available 48-96 hours after online publication and is updated daily on week days.
Initial download of the metrics may take a while.