Fig. 8.
Download original image
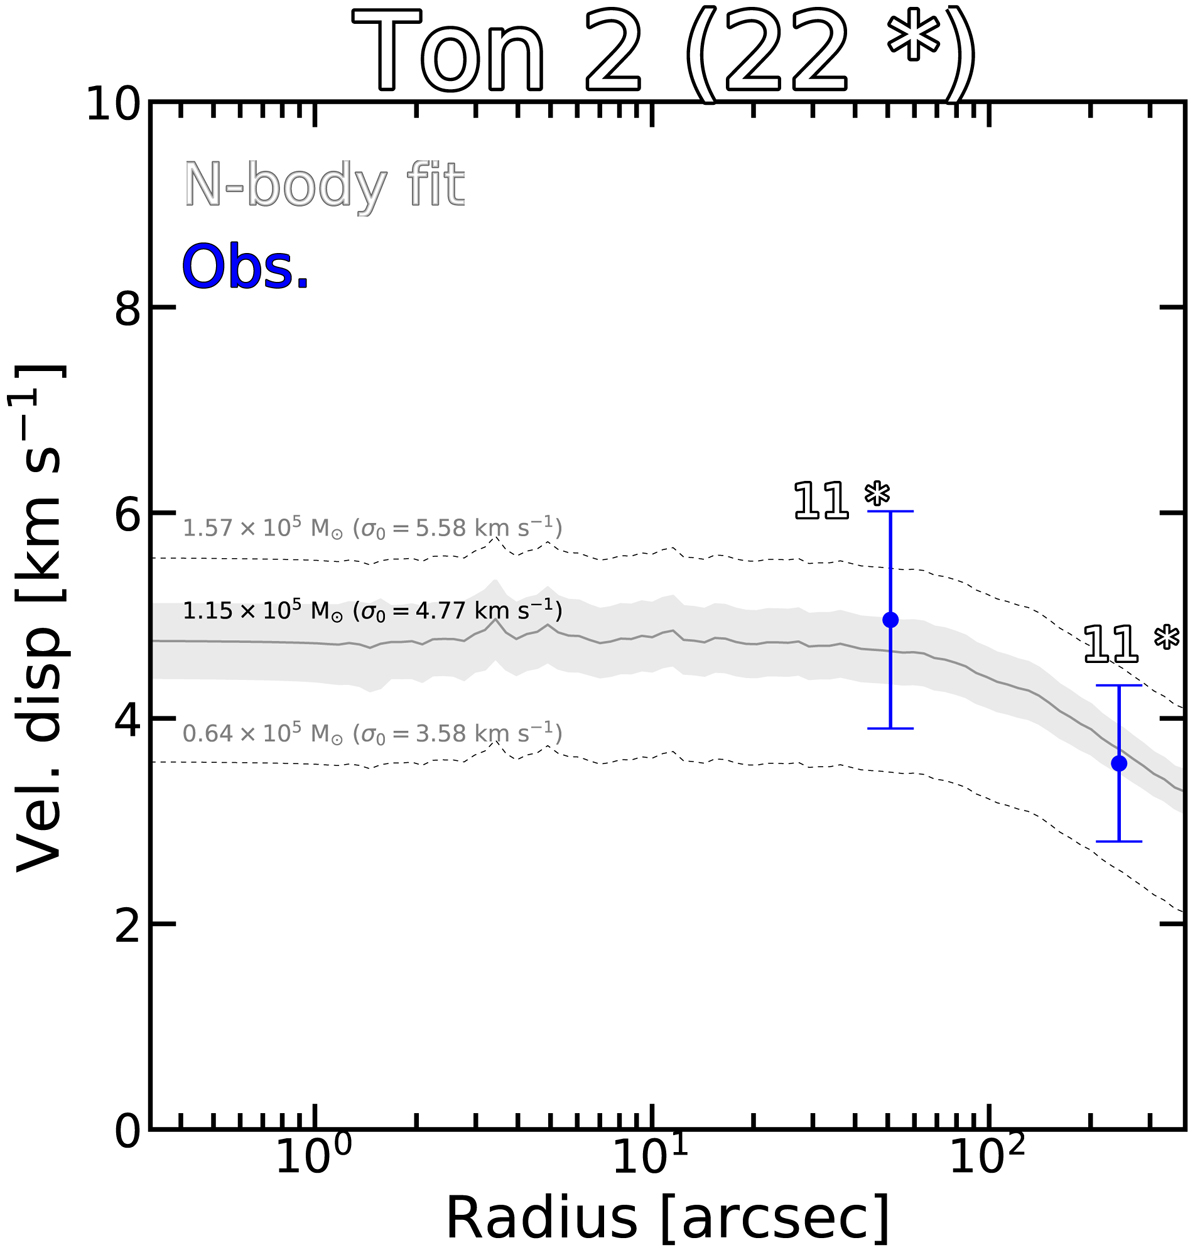
Velocity dispersion profile of Ton 2. Line-of-sight velocity dispersion vs. radius for our target cluster stars from APOGEE-2 plus the Baumgardt et al. (2019) data set. The error bars are calculated as ![]() , with N the number of stars per bin, as indicated in the plot. The prediction of the best-fitting updated (Holger Baumgardt, priv. comm.) N-body model from Baumgardt & Hilker (2018) and Baumgardt et al. (2019) is shown as a solid gray line, and the 1σ uncertainty from the fit as the light gray shaded region. The upper and lower mass limit according to the observed error bars is indicated by the black dashed lines.
, with N the number of stars per bin, as indicated in the plot. The prediction of the best-fitting updated (Holger Baumgardt, priv. comm.) N-body model from Baumgardt & Hilker (2018) and Baumgardt et al. (2019) is shown as a solid gray line, and the 1σ uncertainty from the fit as the light gray shaded region. The upper and lower mass limit according to the observed error bars is indicated by the black dashed lines.
Current usage metrics show cumulative count of Article Views (full-text article views including HTML views, PDF and ePub downloads, according to the available data) and Abstracts Views on Vision4Press platform.
Data correspond to usage on the plateform after 2015. The current usage metrics is available 48-96 hours after online publication and is updated daily on week days.
Initial download of the metrics may take a while.