Fig. 7.
Download original image
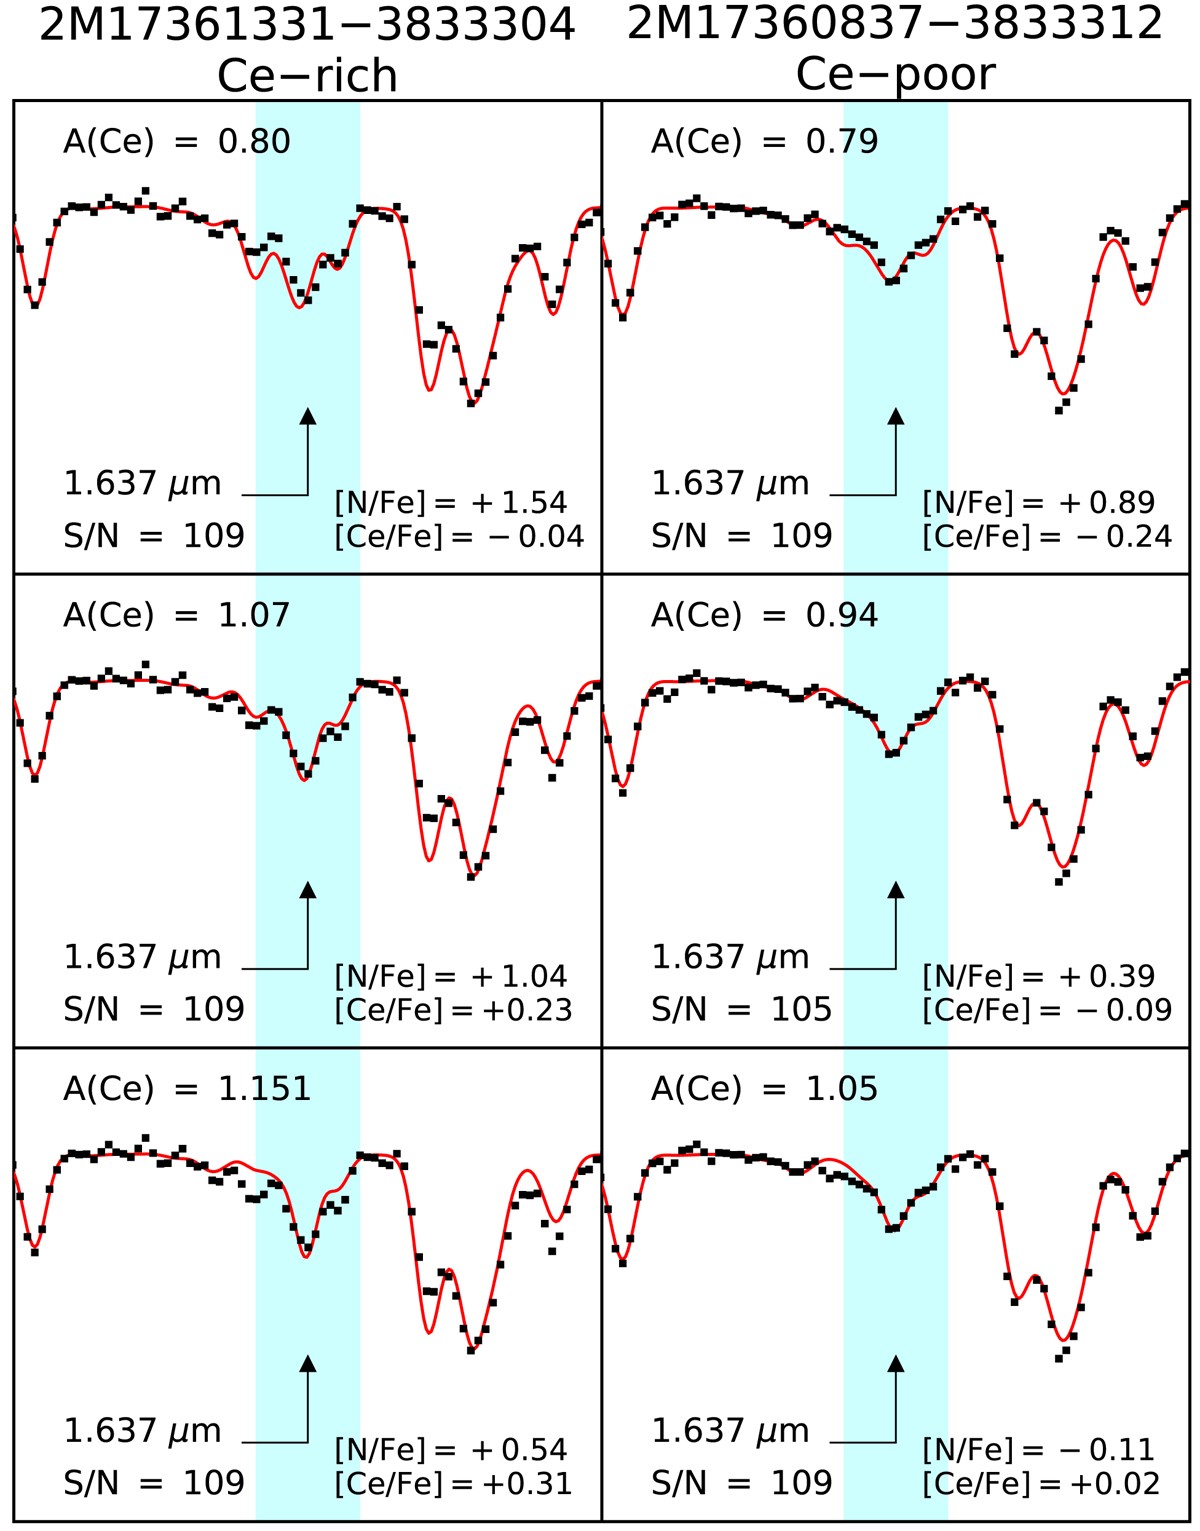
Comparison of synthetic spectra (red lines) to the observed spectra (black symbols) for a Ce-rich and Ce-poor member of Ton 2. In each row we show the effect of changing the abundance of [N/Fe]. The second row shows the case of the best-determined [N/Fe] and [Ce/Fe] abundance ratios listed in Table 2.
Current usage metrics show cumulative count of Article Views (full-text article views including HTML views, PDF and ePub downloads, according to the available data) and Abstracts Views on Vision4Press platform.
Data correspond to usage on the plateform after 2015. The current usage metrics is available 48-96 hours after online publication and is updated daily on week days.
Initial download of the metrics may take a while.