Fig. 2.
Download original image
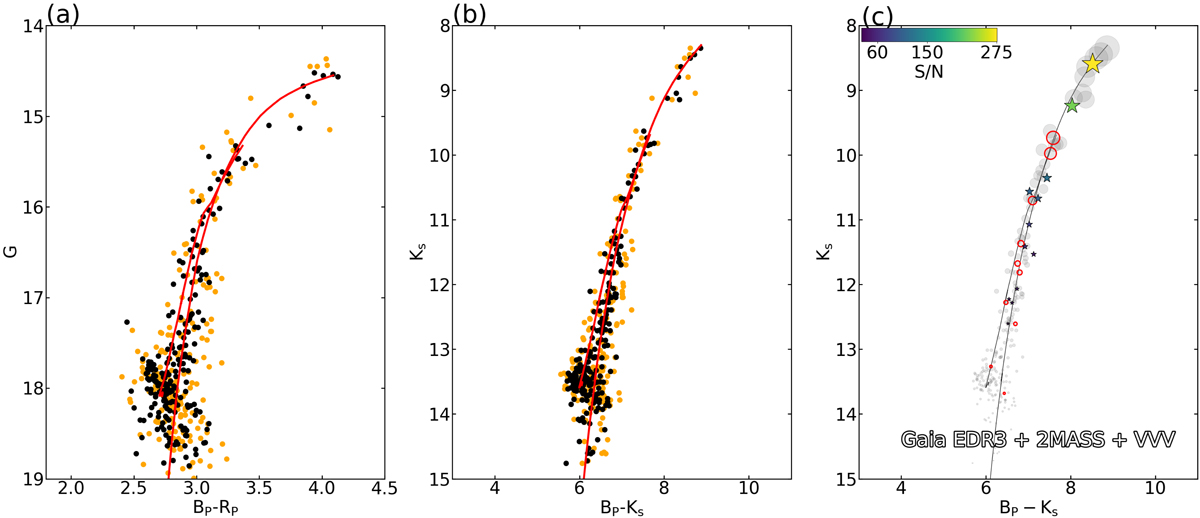
Differential-reddening corrected (black dots) and uncorrected (orange dots) Optical+NIR CMD. The best isochrone fit (red line) to Ton 2 stars (black dots) located within 3.5 arcmin from the cluster center for VVV+2MASS and Gaia EDR3 photometry is shown in panels a and b, respectively, while Ton 2 sources observed with the APOGEE-2 spectrograph are highlighted in the differential-reddening corrected CMD shown in panel c, where the symbol size is proportional to the brightness in the Ks band, and the color-coding refers to the S/N of the spectra (see color bar). Ton 2 sources with RV information from the literature (Baumgardt et al. 2019) are highlighted as red open circles.
Current usage metrics show cumulative count of Article Views (full-text article views including HTML views, PDF and ePub downloads, according to the available data) and Abstracts Views on Vision4Press platform.
Data correspond to usage on the plateform after 2015. The current usage metrics is available 48-96 hours after online publication and is updated daily on week days.
Initial download of the metrics may take a while.