Fig. 6
Download original image
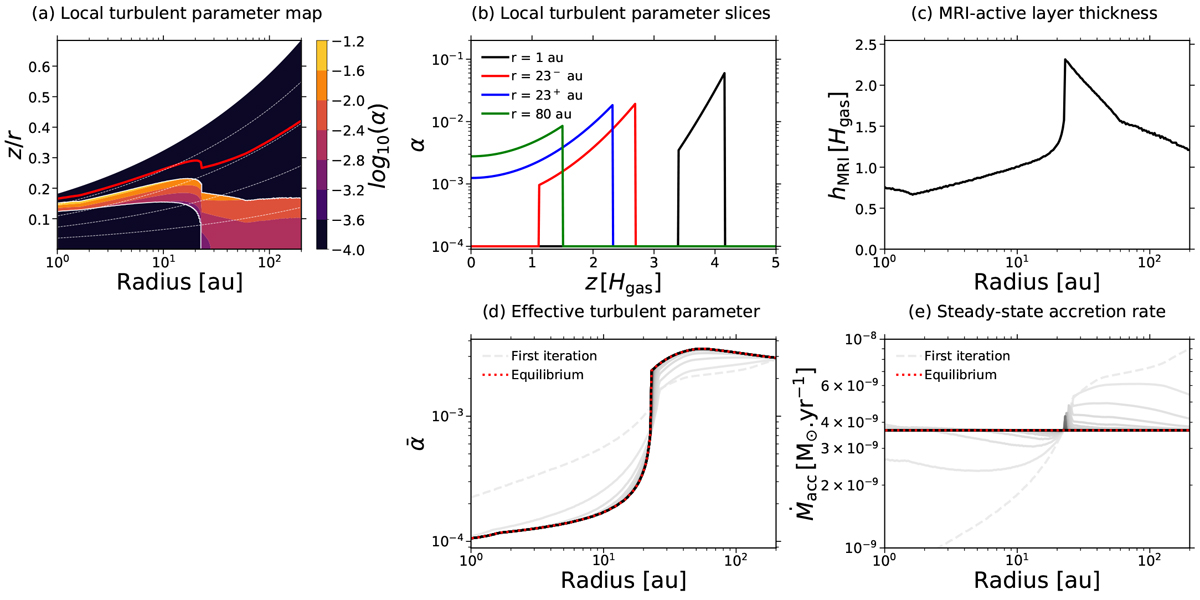
Steady-state quantities describing the turbulence state in the disk for the fiducial model. Panel a: local turbulence parameter, α (Eq. (40)), as a function of location in the disk. The region above the solid red line corresponds to where β > 1. The dashed white lines correspond to the surfaces z = 1 Hgas, z = 2 Hgas, z = 3 Hgas, and z = 4 Hgas, from bottom to top, respectively. Panel b: vertical profiles for the local turbulent parameter, α, at various radial locations, with color codes as in Fig. 4. Panel c: MRI-active layer thickness, hMRI, as a function of radius, expressed in terms of the disk gas scale height, Hgas. Panel d: pressure-weighted vertically integrated turbulent parameter, ![]() (Eq. (6)), as a function of radius. The dashed gray line shows the profile after the first iteration. From light-colored solid lines to dark ones, we show how the pressure-weighted verticallyintegrated turbulent parameter converges through iterations until the equilibrium solution is reached (dotted red line). Panel e: same as in panel d, but for the accretion rate, Ṁacc (Eq. (43)).
(Eq. (6)), as a function of radius. The dashed gray line shows the profile after the first iteration. From light-colored solid lines to dark ones, we show how the pressure-weighted verticallyintegrated turbulent parameter converges through iterations until the equilibrium solution is reached (dotted red line). Panel e: same as in panel d, but for the accretion rate, Ṁacc (Eq. (43)).
Current usage metrics show cumulative count of Article Views (full-text article views including HTML views, PDF and ePub downloads, according to the available data) and Abstracts Views on Vision4Press platform.
Data correspond to usage on the plateform after 2015. The current usage metrics is available 48-96 hours after online publication and is updated daily on week days.
Initial download of the metrics may take a while.