Fig. D.3
Download original image
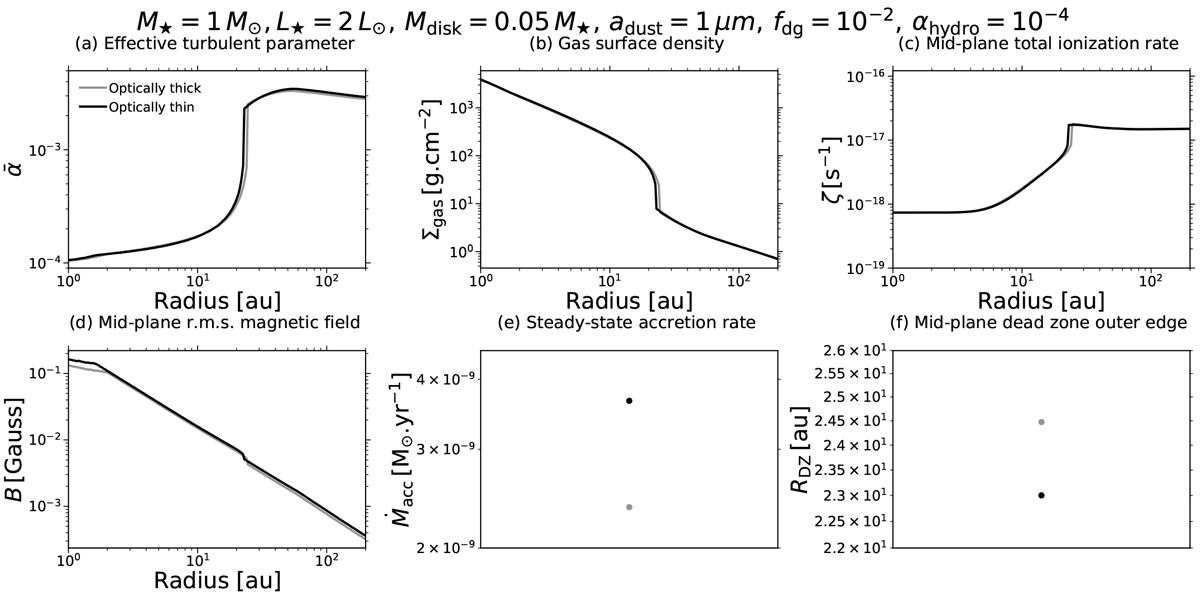
Effect of the gas temperature on the equilibrium solution by varying the radial profile T(r). The "optically thick" case (gray) and the "optically thin" case (black) correspond to the gas temperature profiles displayed in Fig. D.4. The optically thin case corresponds to the gas temperature profile used for the fiducial model described in Sect. 5. The panels show the various steady-state profiles of some key quantities, for the model parameters M⋆ = 1 M⊙, L⋆ = 2 L⊙, Mdisk= 0.05 M⋆, adust = 1 μm, fdg = 10−2, and αhydro = 10−4. Panels (a)-(f) show the same key quantities as in Fig. 7.
Current usage metrics show cumulative count of Article Views (full-text article views including HTML views, PDF and ePub downloads, according to the available data) and Abstracts Views on Vision4Press platform.
Data correspond to usage on the plateform after 2015. The current usage metrics is available 48-96 hours after online publication and is updated daily on week days.
Initial download of the metrics may take a while.