Fig. B.1
Download original image
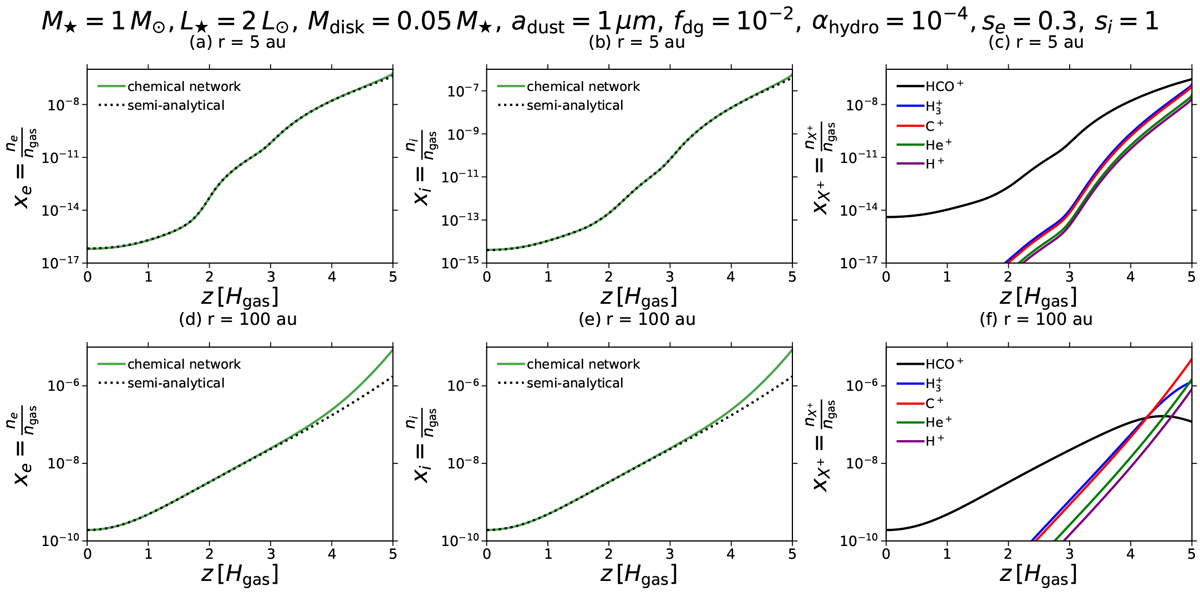
Comparison between the semi-analytical chemical model employed in this study and a chemical reaction network, for the fiducial model described in Sect. 5. The panels show various species abundances as a function of height, z, at r =5 au and r = 100 au (upper and lower rows, respectively). Left panels: Free electron abundance from the chemical reaction network (solid green lines) and the semi-analytical model (dotted black lines). Central panels: Total ion abundance from the chemical reaction network (solid green lines) and the semi-analytical model (dotted black lines). Right panels: Abundances of individual ion species from the chemical reaction network. The solid black line corresponds to HCO+, the solid blue line to H![]() , the solid red line to C+, the solid green line to He+, and the solidpurple line to H+.
, the solid red line to C+, the solid green line to He+, and the solidpurple line to H+.
Current usage metrics show cumulative count of Article Views (full-text article views including HTML views, PDF and ePub downloads, according to the available data) and Abstracts Views on Vision4Press platform.
Data correspond to usage on the plateform after 2015. The current usage metrics is available 48-96 hours after online publication and is updated daily on week days.
Initial download of the metrics may take a while.