Fig. 13
Download original image
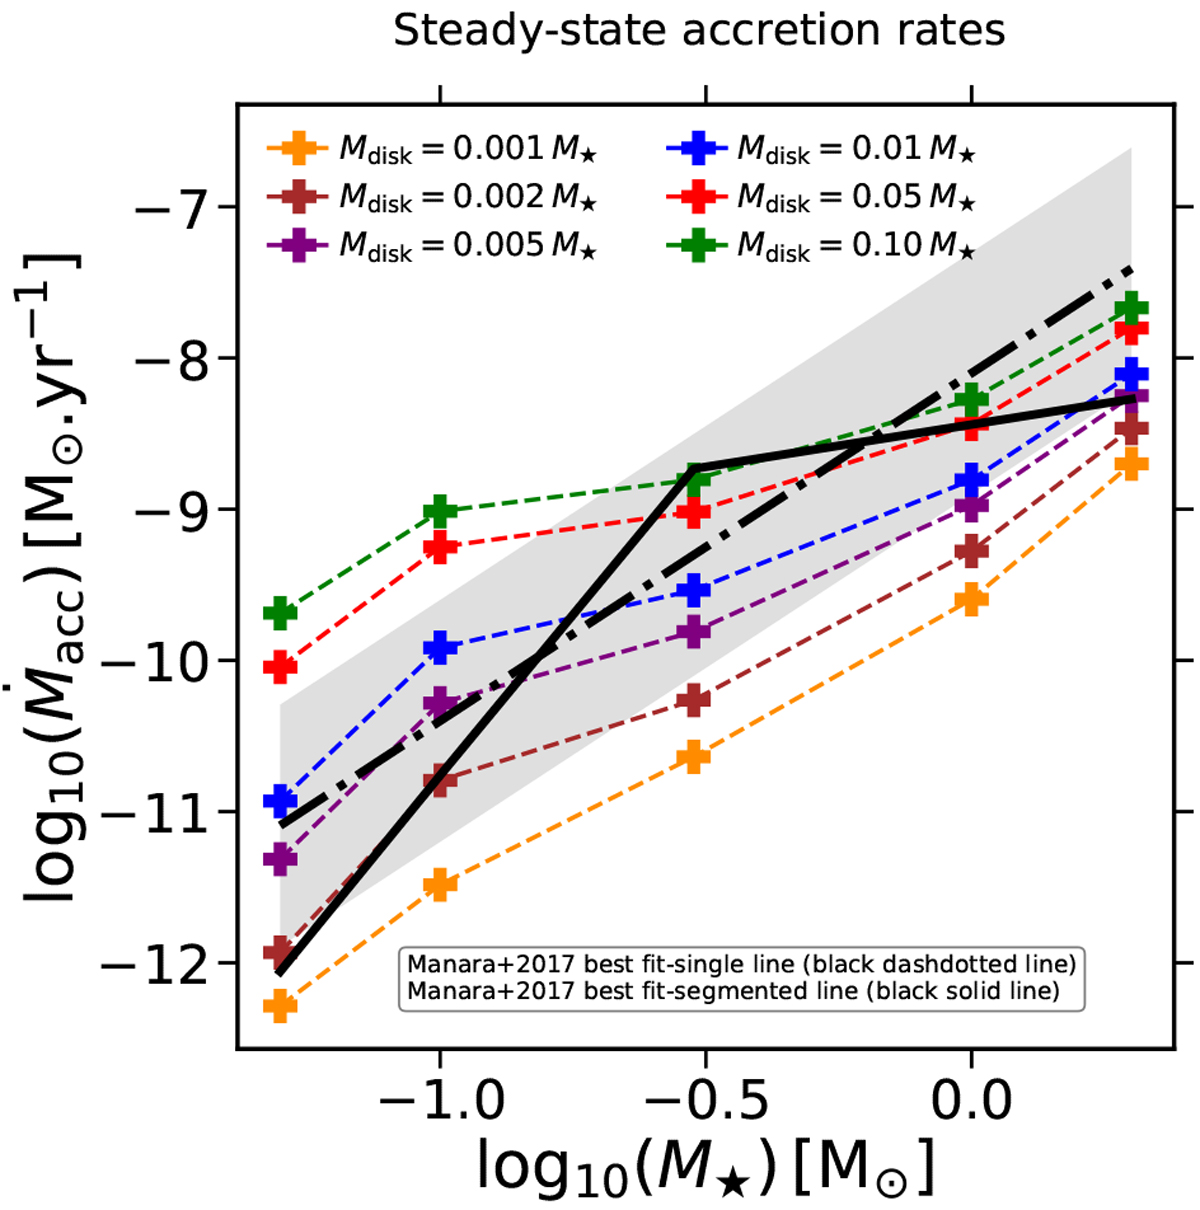
Accretion rate as a function of stellar mass. The dash-dotted and solid black lines correspond to the single-line and segmented-line best-fit models, respectively, from Manara et al. (2017). The 1σ dispersion around the single-line best-fit model is shown by the gray area. The “+” symbols represent the accretion rates obtained for various total disk gas masses and for each star taken from Table 3, using our steady-state accretion model. Here we assume that adust =1 μm, fdg = 10−2, and αhydro = 10−4.
Current usage metrics show cumulative count of Article Views (full-text article views including HTML views, PDF and ePub downloads, according to the available data) and Abstracts Views on Vision4Press platform.
Data correspond to usage on the plateform after 2015. The current usage metrics is available 48-96 hours after online publication and is updated daily on week days.
Initial download of the metrics may take a while.