Fig. 1
Download original image
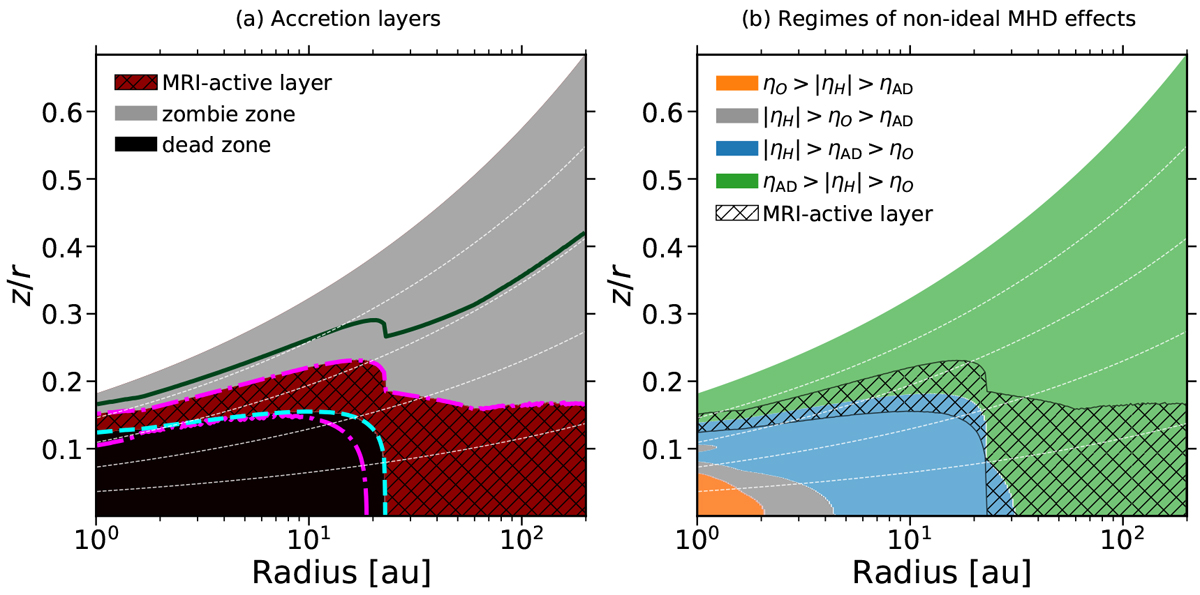
Panel a: steady-state accretion layers, as a function of location in the disk, for the fiducial model. The black colored area corresponds to the dead zone. The gray colored area corresponds to the zombie zone. The red and black hatched area corresponds to the MRI-active layer. The region within the dash-dotted magenta lines defines where the ambipolar condition (β > βmin) is satisfied in the disk, while the region above the dashed cyan line defines where the Ohmic condition (Λ > 1) is fulfilled. The region above the solid green line corresponds to where β > 1. The dashed white lines correspond to the surfaces z = 1 Hgas, z = 2 Hgas, z = 3 Hgas, and z = 4 Hgas, from bottom to top, respectively. Panel b: Regimes of the nonideal MHD effects by showing the dominant magnetic diffusivities as a function of location in the disk. In the orange colored region the Ohmic resistivity dominates (ηO is the highest magnetic diffusivity), in the gray and blue colored regions the Hall effect dominates (|ηH | is the highest magnetic diffusivity), and in the green colored regions ambipolar diffusion dominates (ηAD is the highest magnetic diffusivity). The MRI-active layer is shown by the black hatched area. The dashed white lines are the same as in panel a.
Current usage metrics show cumulative count of Article Views (full-text article views including HTML views, PDF and ePub downloads, according to the available data) and Abstracts Views on Vision4Press platform.
Data correspond to usage on the plateform after 2015. The current usage metrics is available 48-96 hours after online publication and is updated daily on week days.
Initial download of the metrics may take a while.