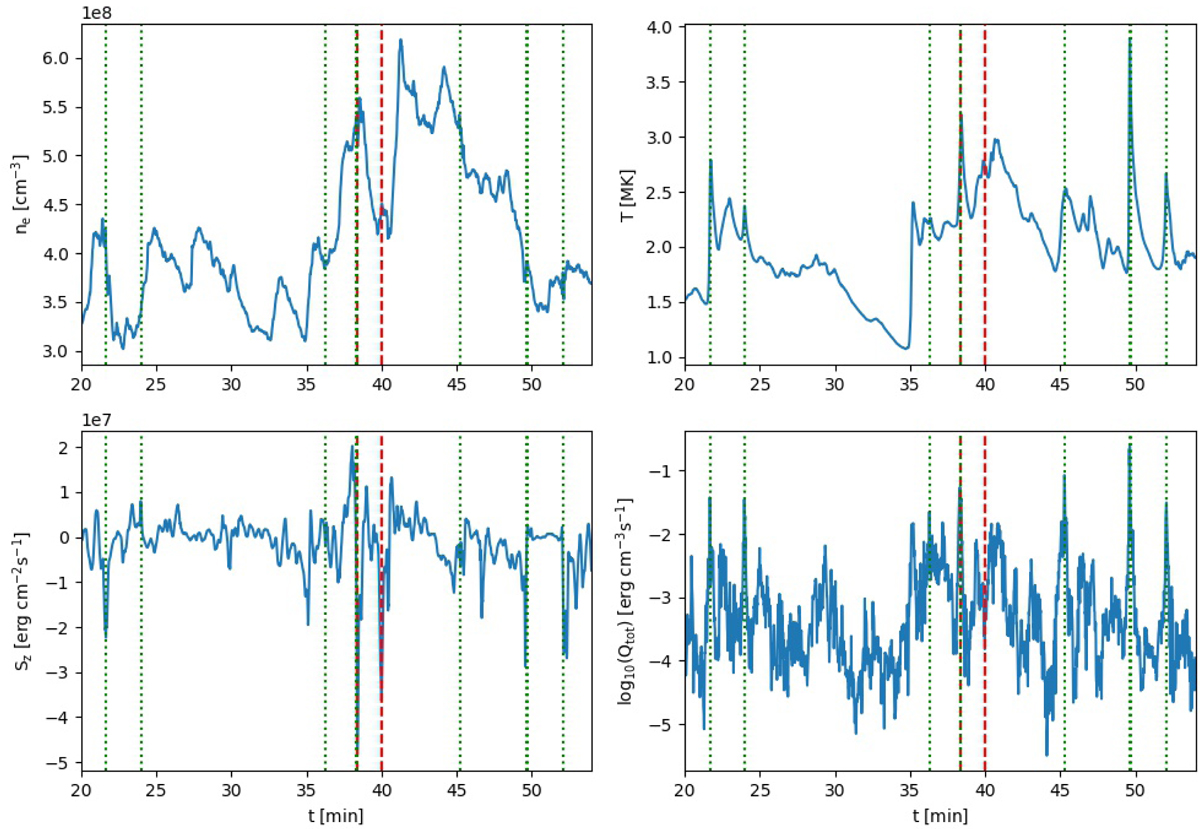
Fig. 9.
Download original image
Time evolution of various quantities at the intersection of the field line shown in Fig. 8 with the loop apex. The red dashed lines mark the two strongest Poynting flux events, while the green dotted lines mark the six strongest heating events, see Sect. 3.2.2. For clarity, only part of the time series containing the strongest heating event at 37.7 min depicted in Fig. 5 is shown.
Current usage metrics show cumulative count of Article Views (full-text article views including HTML views, PDF and ePub downloads, according to the available data) and Abstracts Views on Vision4Press platform.
Data correspond to usage on the plateform after 2015. The current usage metrics is available 48-96 hours after online publication and is updated daily on week days.
Initial download of the metrics may take a while.