| Issue |
A&A
Volume 669, January 2023
|
|
|---|---|---|
| Article Number | C1 | |
| Number of page(s) | 2 | |
| Section | The Sun and the Heliosphere | |
| DOI | https://doi.org/10.1051/0004-6361/202141451e | |
| Published online | 22 December 2022 | |
A solar coronal loop in a box: Energy generationand heating (Corrigendum)
1
Max Planck Institute for Solar System Research, Justus-von-Liebig-Weg 3, 37077 Göttingen, Germany
e-mail: This email address is being protected from spambots. You need JavaScript enabled to view it.
2
School of Space Research, Kyung Hee University, Yongin, Gyeonggi 446-701, Republic of Korea
3
High Altitude Observatory, NCAR, P.O. Box 3000, Boulder, Colorado 80307, USA
Key words: Sun: corona / Sun: magnetic fields / magnetohydrodynamics (MHD) / errata, addenda
The scales on the images of the current density in the original version of the paper were missing a factor of c. The estimated value for the effective diffusivity needs to be corrected by a factor of 4π and should be replaced by ηeff = 1.6 × 1011 cm2 s−1. Finally, the units on the y-axis of Fig. 16 should have been DN pix−1 s−1 instead of DN pix s. The new versions of the figures presented here have been corrected. These corrections do not affect the conclusions of the original paper.
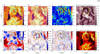 |
Fig. 10. Cut through the loop at the apex (cross section perpendicular to the loop axis). (a) Temperature; (b) electron density; (c) magnitude of the velocity perpendicular to the loop axis; (d) emission in the 211 Å channel of AIA; (e) axial component of the velocity; (f) axial component of the Poynting flux; (g) axial component of the current density; and (h) emission as seen with the Al-poly filter of XRT. The black arrows illustrate the horizontal velocity field. The yellow box highlights the location of a vortex with enhanced temperature and density. The snapshot was taken at t = 41.02 min. |
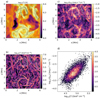 |
Fig. 13. Cut through the loop at the apex (cross section perpendicular to the loop axis). (a) Temperature; (b) sum of viscous and resistive heating; (c) squared current density; and (d) 2D histogram of the total numerical heating rate vs. the squared current density. |
 |
Fig. 14. 2D histograms of the temperature, total heating, squared current density, and X-ray emission at the apex vs. the velocity perpendicular to the loop axis. The X-ray emission has been computed to correspond to what XRT on Hinode would measure. The quantities have been averaged over a time range of 15 minutes. |
© The Authors 2022
 Open Access article, published by EDP Sciences, under the terms of the Creative Commons Attribution License (https://creativecommons.org/licenses/by/4.0), which permits unrestricted use, distribution, and reproduction in any medium, provided the original work is properly cited.
This article is published in open access under the Subscribe-to-Open model.
Open Access funding provided by Max Planck Society.
All Figures
|
Fig. 10. Cut through the loop at the apex (cross section perpendicular to the loop axis). (a) Temperature; (b) electron density; (c) magnitude of the velocity perpendicular to the loop axis; (d) emission in the 211 Å channel of AIA; (e) axial component of the velocity; (f) axial component of the Poynting flux; (g) axial component of the current density; and (h) emission as seen with the Al-poly filter of XRT. The black arrows illustrate the horizontal velocity field. The yellow box highlights the location of a vortex with enhanced temperature and density. The snapshot was taken at t = 41.02 min. |
| In the text | |
|
Fig. 13. Cut through the loop at the apex (cross section perpendicular to the loop axis). (a) Temperature; (b) sum of viscous and resistive heating; (c) squared current density; and (d) 2D histogram of the total numerical heating rate vs. the squared current density. |
| In the text | |
|
Fig. 14. 2D histograms of the temperature, total heating, squared current density, and X-ray emission at the apex vs. the velocity perpendicular to the loop axis. The X-ray emission has been computed to correspond to what XRT on Hinode would measure. The quantities have been averaged over a time range of 15 minutes. |
| In the text | |
Current usage metrics show cumulative count of Article Views (full-text article views including HTML views, PDF and ePub downloads, according to the available data) and Abstracts Views on Vision4Press platform.
Data correspond to usage on the plateform after 2015. The current usage metrics is available 48-96 hours after online publication and is updated daily on week days.
Initial download of the metrics may take a while.