Fig. 8.
Download original image
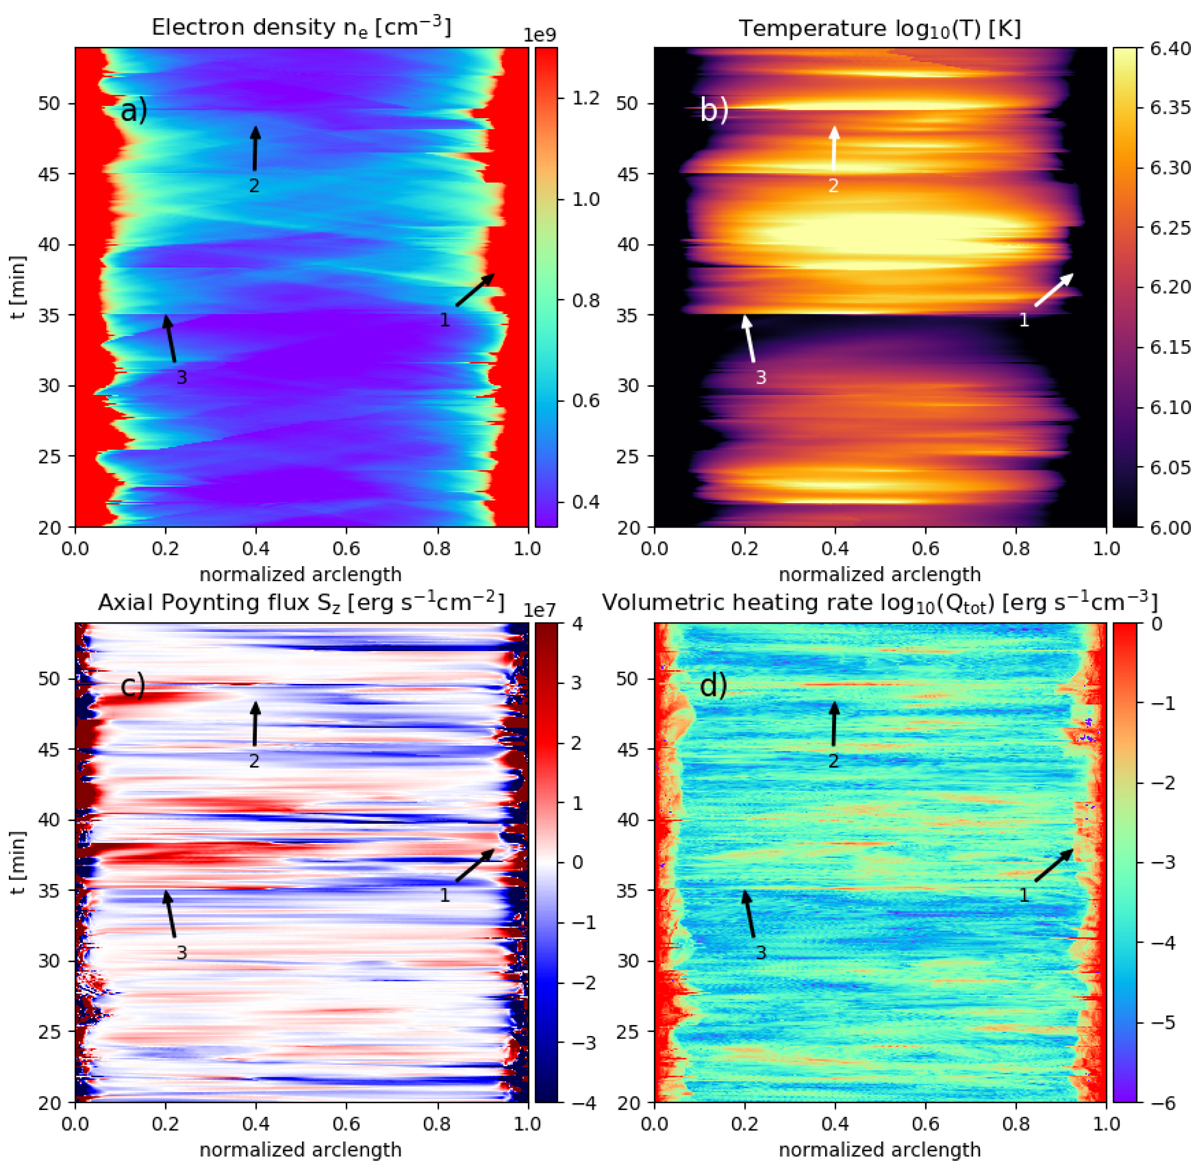
Spatio-temporal evolution along a field line with the arclength of the field line on the abscissa and time on the ordinate. The quantities shown are electron density (a), temperature (b), axial component of the Poynting flux (c), and total heating rate (d). Temperature and heating rate are scaled logarithmically. Positive Poynting flux (red) indicates energy propagating in the direction of increasing arc length (to the right), negative Poynting flux (blue) is in the opposite direction. The seed point from which the field line is traced is advected in time with the plasma velocity. The arrows mark locations of Poynting flux reaching the opposite chromosphere (1), dissipation (2), and reconnection (3), see Sect. 3.2.2. For clarity, only the part of the time series containing the strongest heating event at 37.7 min depicted in Fig. 5 is shown.
Current usage metrics show cumulative count of Article Views (full-text article views including HTML views, PDF and ePub downloads, according to the available data) and Abstracts Views on Vision4Press platform.
Data correspond to usage on the plateform after 2015. The current usage metrics is available 48-96 hours after online publication and is updated daily on week days.
Initial download of the metrics may take a while.