Fig. 7.
Download original image
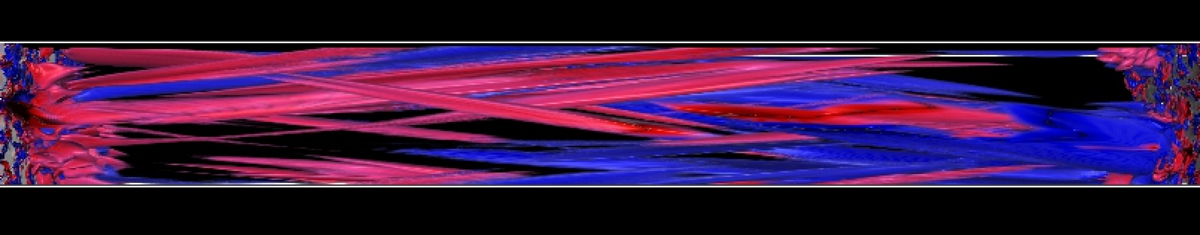
Volume rendering of the axial component of the Poynting flux in the Solar atmosphere in a given snapshot at time 24.34 min. The Poynting flux directed in the positive s-direction (that is, from left to right in this figure) is shown in red and the Poynting flux directed in the negative s-direction is shown in blue. The s-axis is defined as the coordinate along the loop axis. The range of the color scale is −1 × 10⁸ to +1 × 10⁸ erg s−1 cm−2. The figure shows the volume encompassing chromosphere and corona between the two photospheres, one at each footpoint. See Sect. 3.3.
Current usage metrics show cumulative count of Article Views (full-text article views including HTML views, PDF and ePub downloads, according to the available data) and Abstracts Views on Vision4Press platform.
Data correspond to usage on the plateform after 2015. The current usage metrics is available 48-96 hours after online publication and is updated daily on week days.
Initial download of the metrics may take a while.