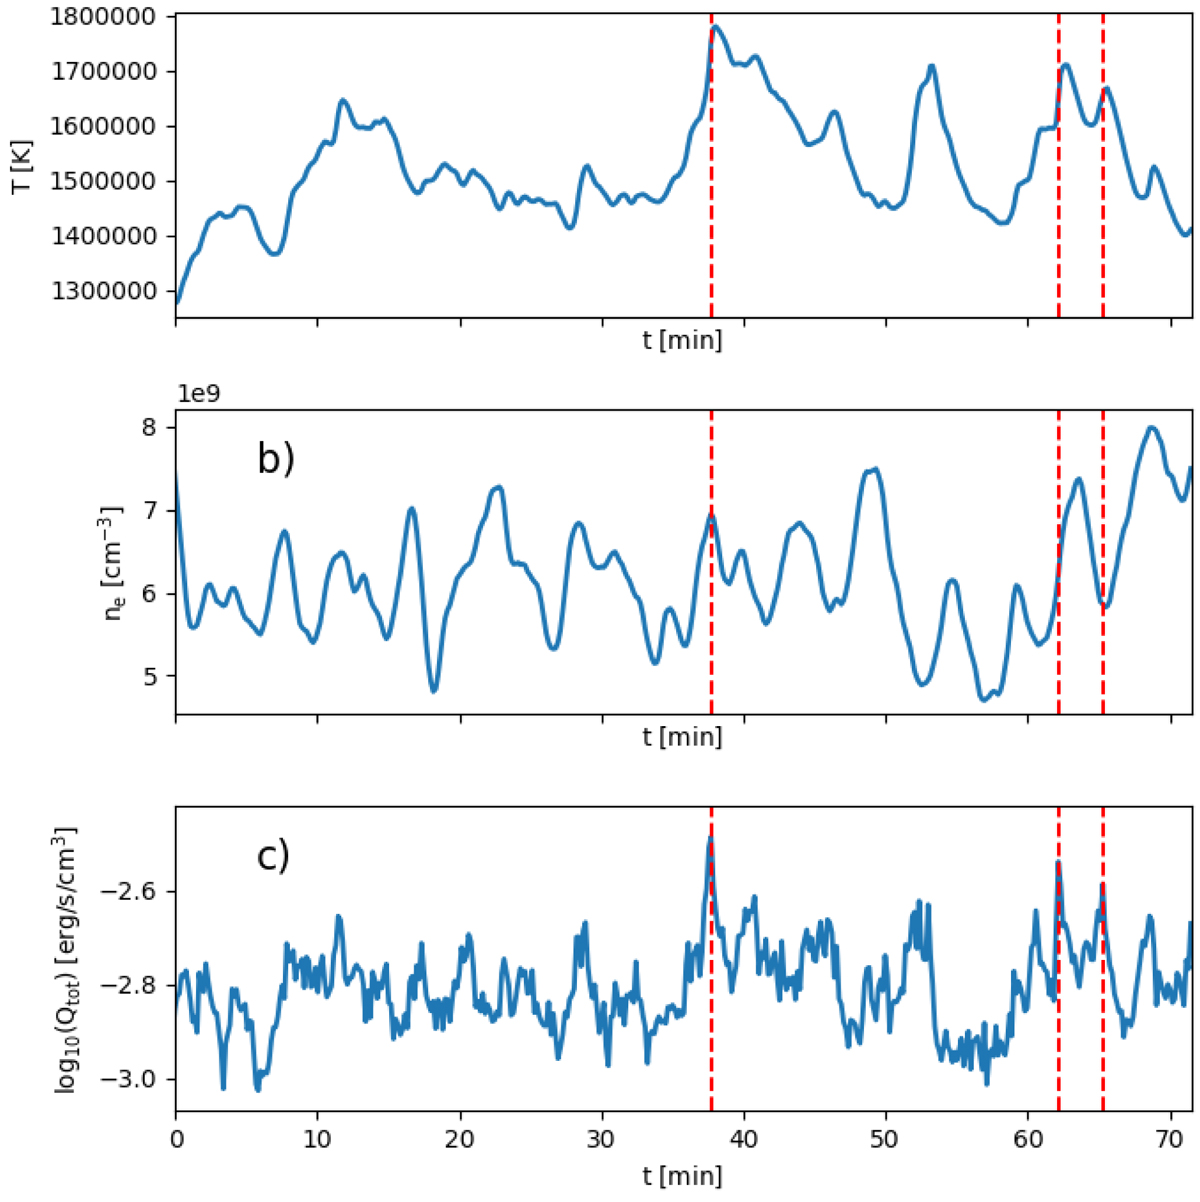
Fig. 5.
Download original image
Averaged quantities in the coronal part of the simulation domain as a function of time. We define t = 0 s as the time when we start collecting snapshots after the simulation extended to the coronal part has run for an hour of solar time. Panel a shows the temperature, panel b the electron density and panel c the sum of viscous and resistive heating. All quantities have been averaged over regions with densities below 10−12 g cm−3. The vertical dashed lines highlight several strong heating events. For a discussion of the time evolution see Sects. 3.1 and 4.1.
Current usage metrics show cumulative count of Article Views (full-text article views including HTML views, PDF and ePub downloads, according to the available data) and Abstracts Views on Vision4Press platform.
Data correspond to usage on the plateform after 2015. The current usage metrics is available 48-96 hours after online publication and is updated daily on week days.
Initial download of the metrics may take a while.