Fig. 3.
Download original image
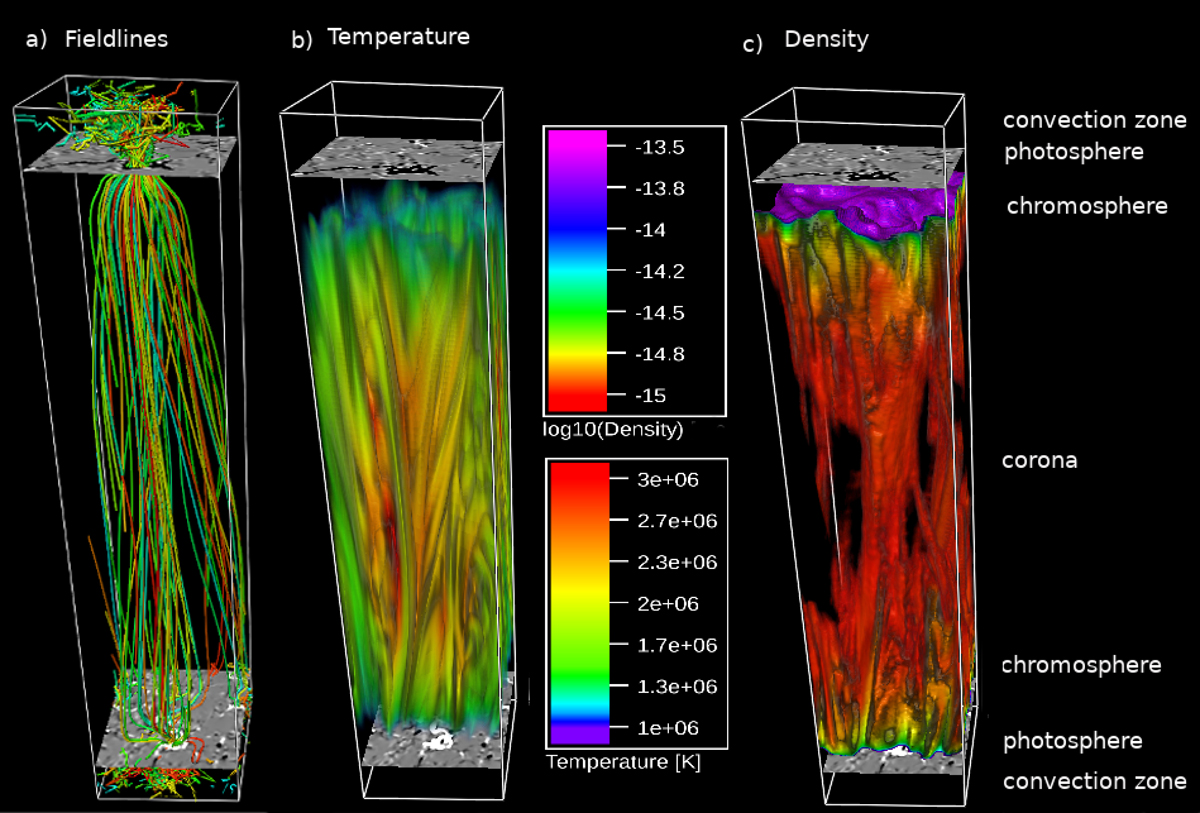
Simulation setup. (a) Example magnetic field lines in the simulation box traced from locations with strong magnetic field. The vertical magnetic field is plotted on a horizontal cut at the average photospheric height. (b) Volume rendering of the loop temperature in K. (c) Volume rendering of the loop density in g cm−3. The s-axis (along the loop) has been compressed by a factor of two for better visibility.
Current usage metrics show cumulative count of Article Views (full-text article views including HTML views, PDF and ePub downloads, according to the available data) and Abstracts Views on Vision4Press platform.
Data correspond to usage on the plateform after 2015. The current usage metrics is available 48-96 hours after online publication and is updated daily on week days.
Initial download of the metrics may take a while.