Fig. 2.
Download original image
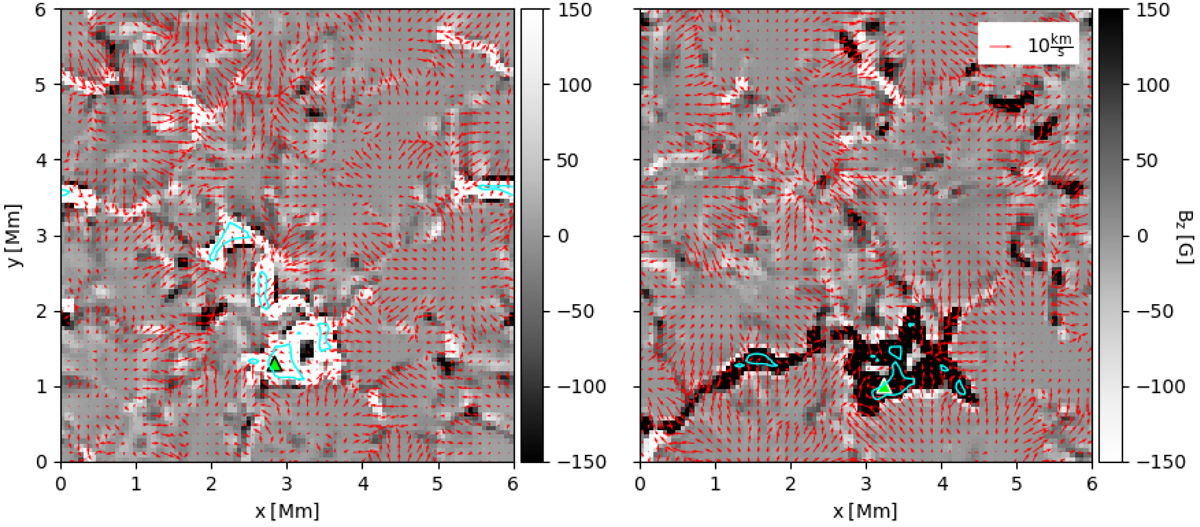
Vertical magnetic field at the photosphere at both loop footpoints at the depth where ⟨τ⟩=1. The snapshot was taken at t = 24.34 min. The red arrows show the magnitude of the horizontal velocity at the photospheric level (see legend at top right). The blue contours indicate regions with |Bz|> 1000 G. The green triangles mark the footpoints of the fieldline investigated in Sect. 3.2.2. For a discussion of the initial condition for the magnetic field see Sect. 2.3. A movie is available online.
Current usage metrics show cumulative count of Article Views (full-text article views including HTML views, PDF and ePub downloads, according to the available data) and Abstracts Views on Vision4Press platform.
Data correspond to usage on the plateform after 2015. The current usage metrics is available 48-96 hours after online publication and is updated daily on week days.
Initial download of the metrics may take a while.