Fig. 16.
Download original image
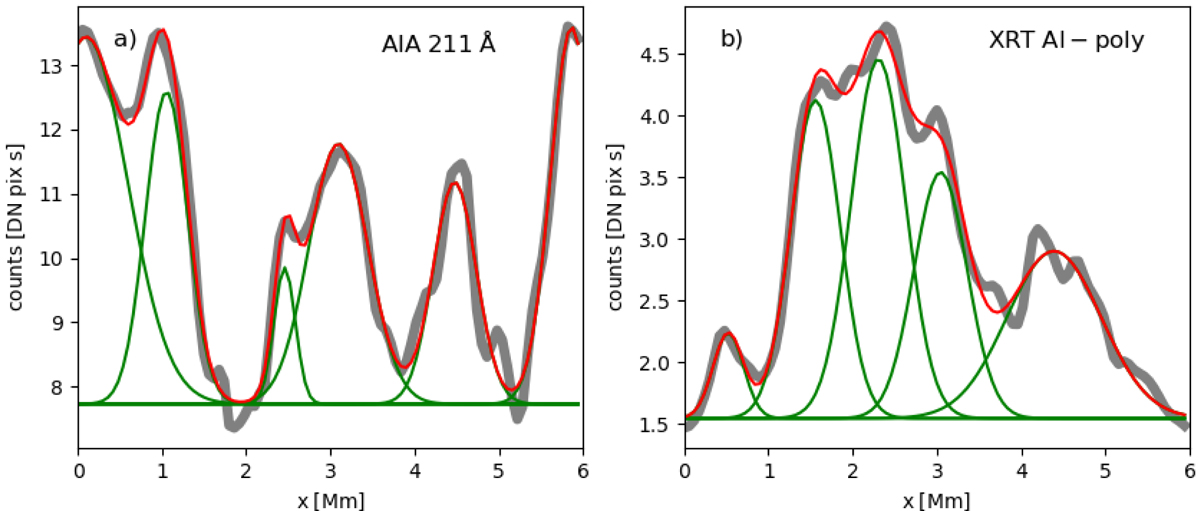
Cross-sectional cut of the loop in coronal emission. The gray thick lines show cuts at the apex of the loop as displayed in Fig. 15 for AIA 211 Å and XRT at the original resolution. To quantify these cross-sectional cuts we show multi-Gaussian fits with a constant background in each case. The individual Gaussians of the fit are shown in green, the sum of all Gaussians in red. See Sect. 3.4.
Current usage metrics show cumulative count of Article Views (full-text article views including HTML views, PDF and ePub downloads, according to the available data) and Abstracts Views on Vision4Press platform.
Data correspond to usage on the plateform after 2015. The current usage metrics is available 48-96 hours after online publication and is updated daily on week days.
Initial download of the metrics may take a while.