Fig. 15.
Download original image
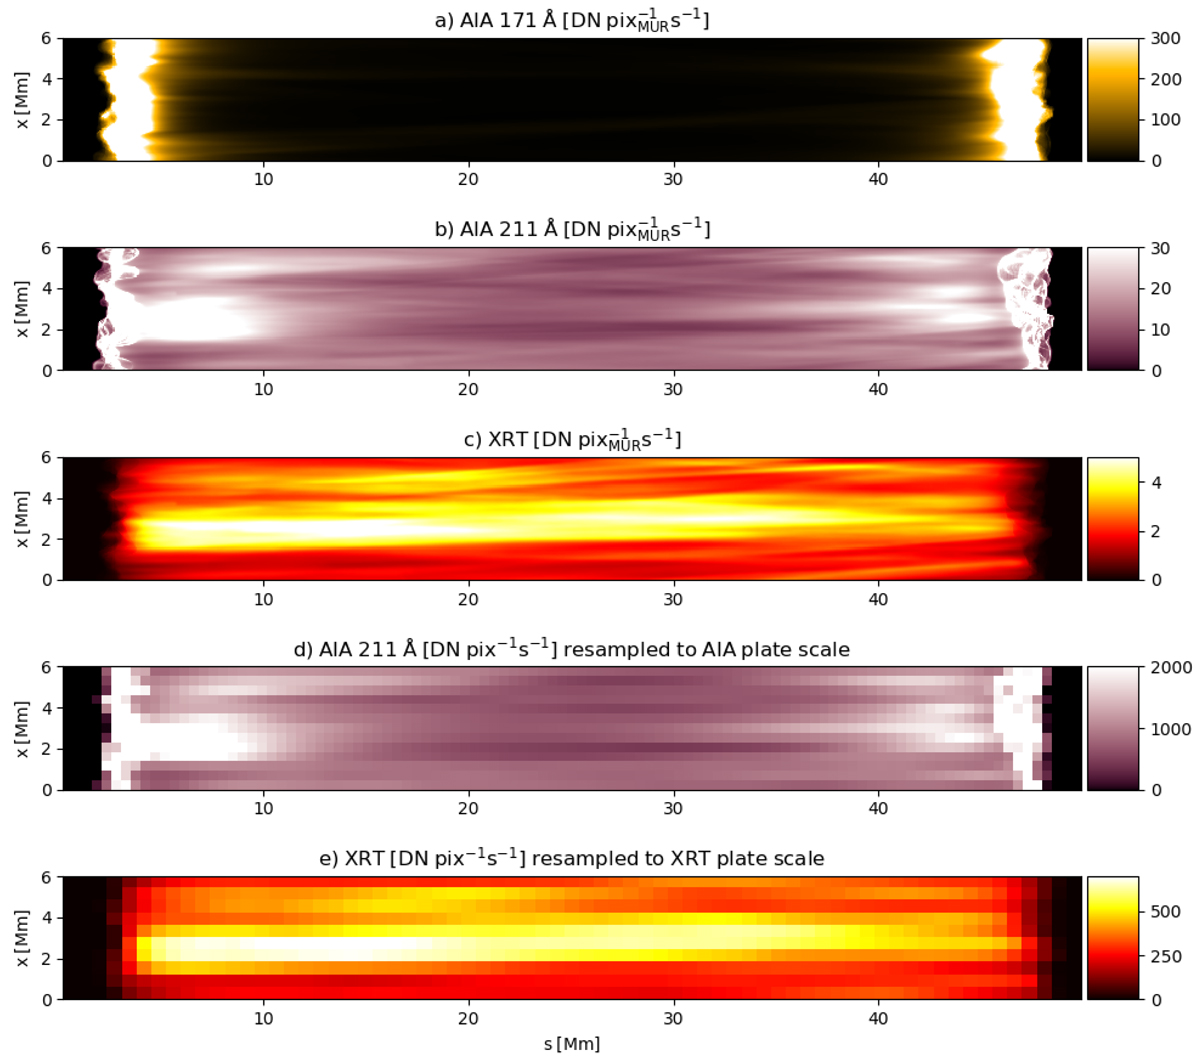
View of the simulated loop from the side as seen in EUV and X-ray observations. Panels a–c: view at the original resolution of the numerical model, panels d and e: images downsampled to the plate scale of the instruments. From top to bottom: synthetic emission for the 171 Å and 211 Å AIA bands integrated along the y-axis, emission as would be measured with the Al-poly filter of XRT, degraded synthetic emission in the 211 Å band taking into account the pixel size of the AIA instrument of 0.6″, degraded emission for XRT with a pixel size of ∼1″. The synthetic emission has been integrated along the line of sight perpendicular to the loop axis. See Sect. 3.4.
Current usage metrics show cumulative count of Article Views (full-text article views including HTML views, PDF and ePub downloads, according to the available data) and Abstracts Views on Vision4Press platform.
Data correspond to usage on the plateform after 2015. The current usage metrics is available 48-96 hours after online publication and is updated daily on week days.
Initial download of the metrics may take a while.