Fig. 14.
Download original image
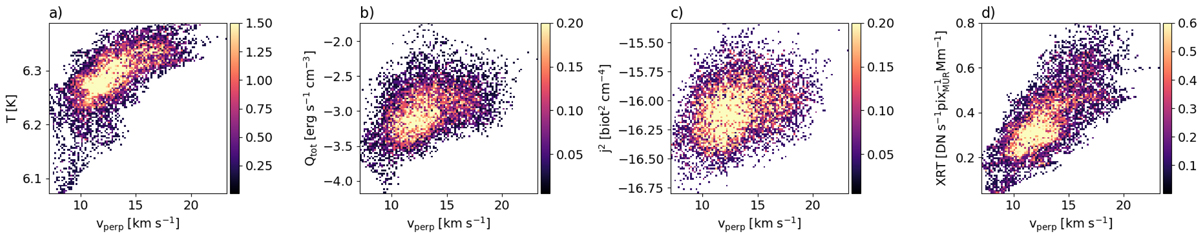
2D histograms of the temperature, total heating, squared current density, and X-ray emission at the apex vs. the velocity perpendicular to the loop axis. The X-ray emission has been computed to correspond to what XRT on Hinode would measure. The quantities have been averaged over a time range of 15 min. See Sect. 3.3.1.
Current usage metrics show cumulative count of Article Views (full-text article views including HTML views, PDF and ePub downloads, according to the available data) and Abstracts Views on Vision4Press platform.
Data correspond to usage on the plateform after 2015. The current usage metrics is available 48-96 hours after online publication and is updated daily on week days.
Initial download of the metrics may take a while.