Fig. 13.
Download original image
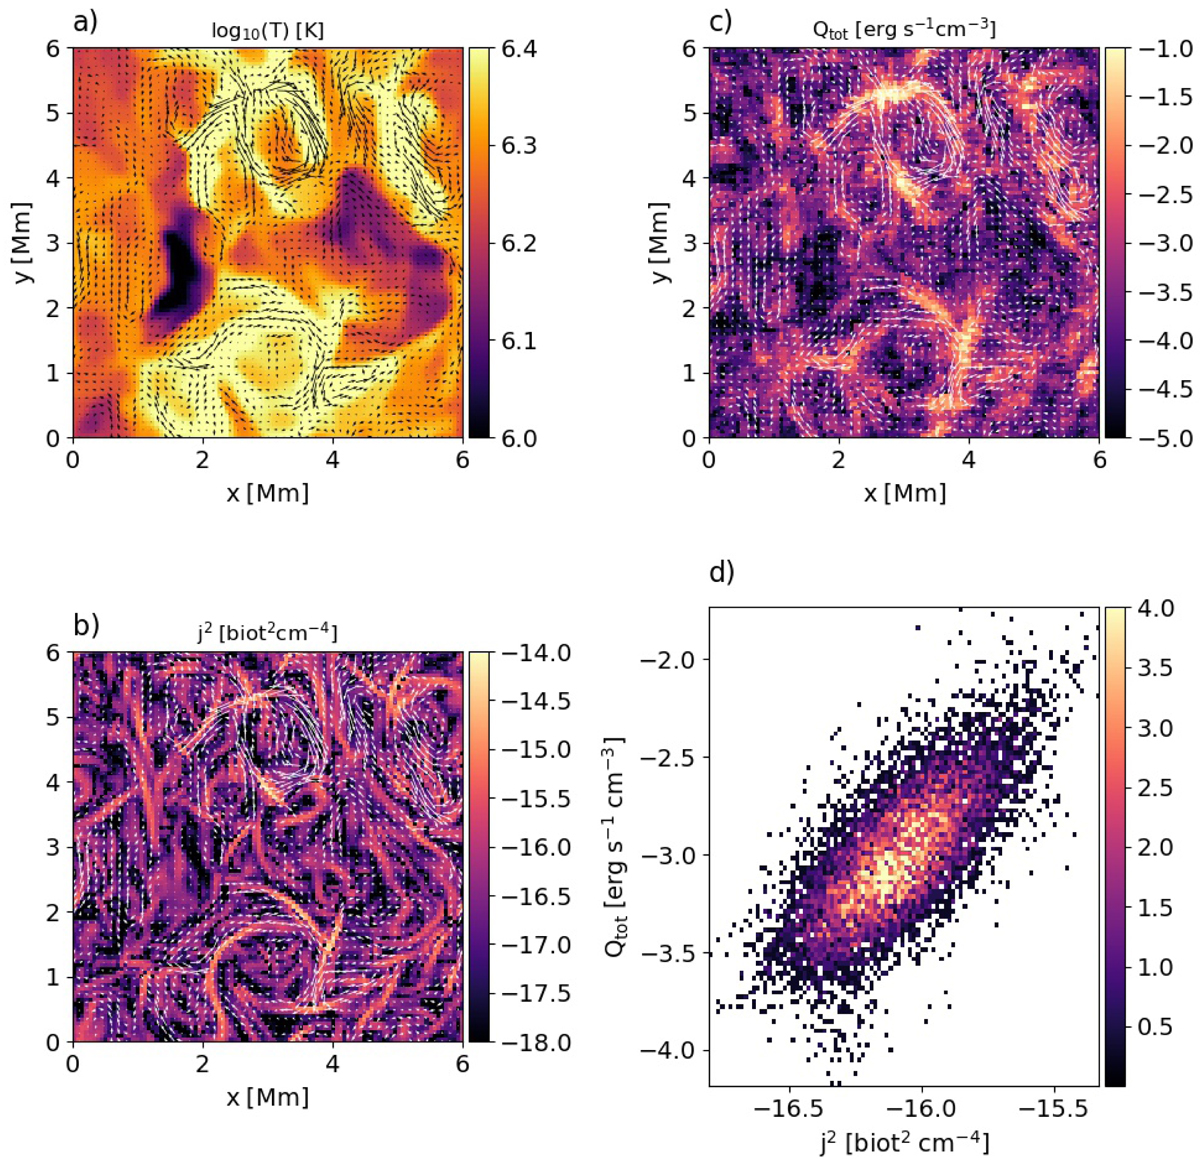
Cut through the loop at the apex (cross section perpendicular to the loop axis). (a) Temperature; (b) sum of viscous and resistive heating; (c) squared current density; (d) 2D histogram of the total numerical heating rate vs. the squared current density.
Current usage metrics show cumulative count of Article Views (full-text article views including HTML views, PDF and ePub downloads, according to the available data) and Abstracts Views on Vision4Press platform.
Data correspond to usage on the plateform after 2015. The current usage metrics is available 48-96 hours after online publication and is updated daily on week days.
Initial download of the metrics may take a while.