Fig. 10.
Download original image
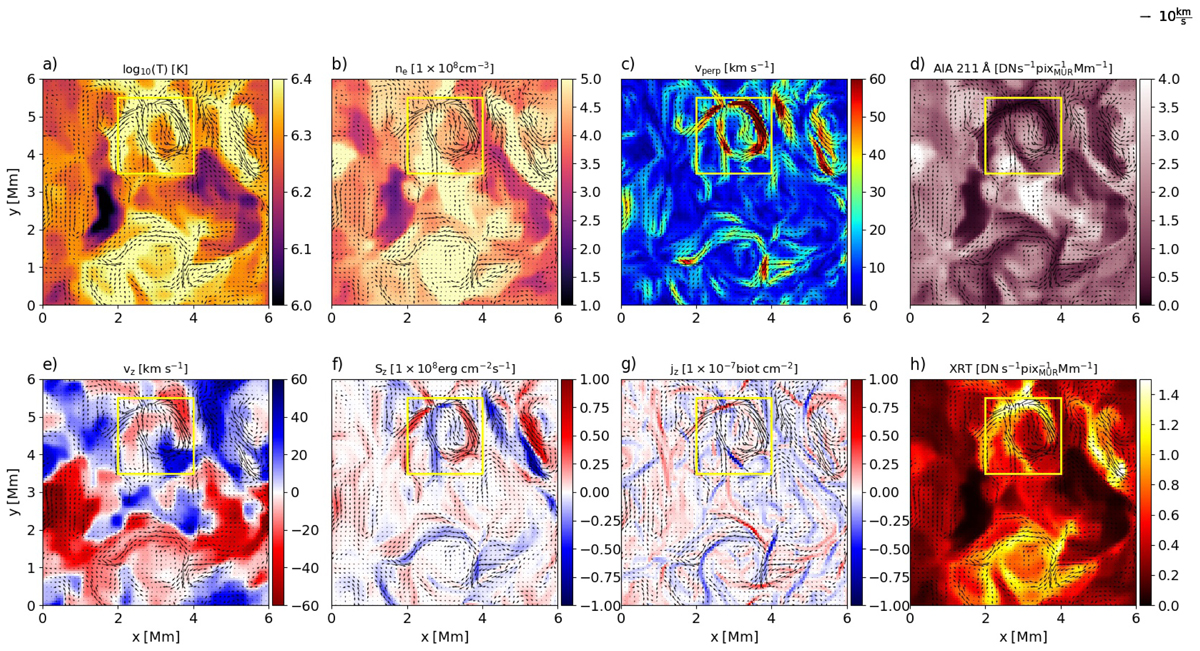
Cut through the loop at the apex (cross section perpendicular to the loop axis). (a) Temperature; (b) Electron density; (c) Magnitude of the velocity perpendicular to the loop axis; (d) emission in the 211 Å channel of AIA, (e) Axial component of the velocity; (f) Axial component of the Poynting flux; (g) Axial component of the current density, (h) emission as seen with the Al-poly filter of XRT. The black arrows illustrate the horizontal velocity field. The yellow box highlights the location of a vortex with enhanced temperature and density. The snapshot was taken at t = 41.02 min. See Sect. 3.3.
Current usage metrics show cumulative count of Article Views (full-text article views including HTML views, PDF and ePub downloads, according to the available data) and Abstracts Views on Vision4Press platform.
Data correspond to usage on the plateform after 2015. The current usage metrics is available 48-96 hours after online publication and is updated daily on week days.
Initial download of the metrics may take a while.